

Time Series
The Time Series tab shows you when things changed, not just what people said. It trends your tracked metric or overall sentiment over time and maps it to underlying topics to understand cause and effect and in doing so, deliver a level of comprehension and actionality from tracking studies that has never been possible before.
The tab appears in your report when Time Series is included for the page during project setup. What it trends depends on the measure you chose in the Define Your Measure step — overall sentiment, or a data variable such as OSAT or NPS reported as a mean or as a score based on a range of values.
Choosing a time grouping
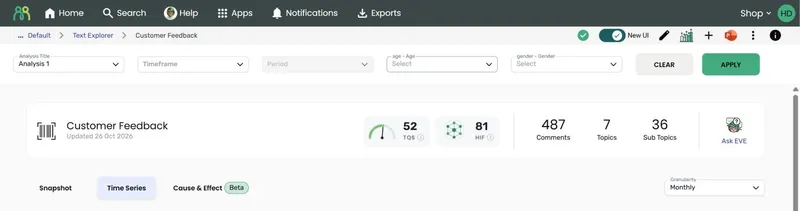
Section titled “Choosing a time grouping”While the Time Series tab is open, a Granularity dropdown appears at the right of the report tabs. Use it to change how periods are grouped — Weekly, Monthly, Quarterly, Yearly, or Financial Year. The tab opens on Monthly.
- If you’ve chosen a Timeframe in the filter bar, an option is only offered when that timeframe covers at least three periods of that size — for example, a timeframe of under three months won’t offer Quarterly. With no timeframe chosen, every option is offered.
- Financial Year is only offered if you ticked it in the Date Aggregation panel during setup. Financial year periods follow the start month you chose there, and are labelled like FY 2025/26.
Every section of the tab updates together when you change the grouping, except the Calendar Heat Map, which is always shown day by day.
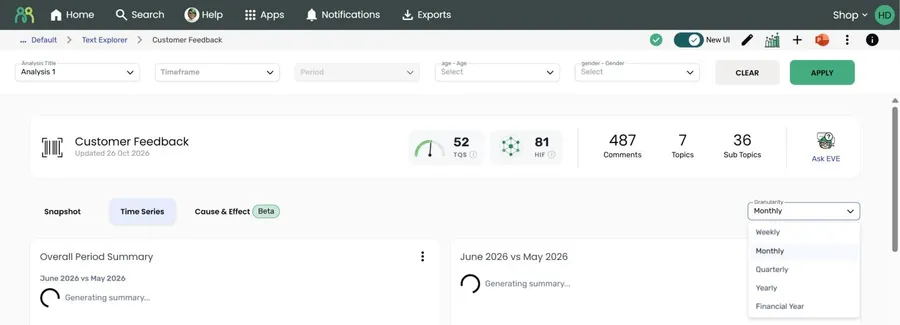
The tab also responds to the standard filter bar at the top of the report — timeframe, period, and any filter variables you added to the project.
Which periods are compared
Section titled “Which periods are compared”The tab compares the two most recent periods that have data — empty periods are skipped. Headings name the actual periods rather than “this period” and “last period”, for example June 2026 vs May 2026, Q2 2026 vs Q1 2026, or Week ending 31 May 2026.
Overall Period Summary
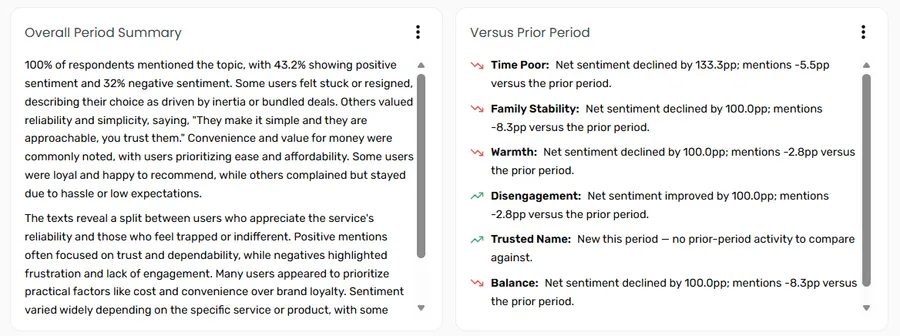
Section titled “Overall Period Summary”An AI-written narrative comparing the two most recent periods: how many customers commented, the sentiment split, the key themes, and standout quotes pulled straight from the responses. It’s the “what’s the story this period?” answer before you look at a single chart. The periods being compared are shown under the heading.
Versus Prior Period
Section titled “Versus Prior Period”Alongside the summary, this panel lists the sub topics that have genuinely moved since the previous period. Its heading names the two periods, for example June 2026 vs May 2026.
Each entry shows the sub topic name and a short AI-written sentence explaining what changed, with an icon showing whether the change is good news (up), bad news (down), or flat. A rise in negative sentiment, for example, shows as bad news. Sub topics with the most significant changes are listed first.
A sub topic only shows up here if its mentions, positive sentiment, or negative sentiment changed significantly — so you’re looking at the changes that matter, not noise. If nothing moved enough, the panel says so. The base sizes for both periods sit at the bottom of the panel.
Metric trend
Section titled “Metric trend”The trend chart plots your tracked metric over time. Its title reflects what you chose to track during setup — Overall Sentiment Trend, or Overall followed by your Metric Label, such as Overall OSAT Trend. If you’re tracking a range score, the chart plots the score percentage per period.
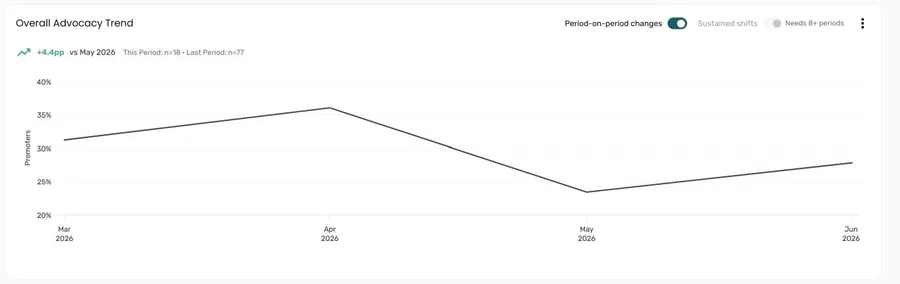
Above the chart, a change indicator summarises the latest movement against the previous period — for example, -32.1pp vs May 2026 — along with the base sizes for both periods.
If you’re tracking overall sentiment, use the Positive Sentiment and Negative Sentiment buttons to switch which line is shown. On the Negative line, a rise counts as bad news and shows in red.
Two switches above the chart add markers to the line. Both are on by default:
| Switch | What it shows |
|---|---|
| Period-on-period changes | A coloured dot on each period that changed significantly from the one before — green for an improvement, red for a decline. Hover over a dot to see the change and up to three sub topics that also shifted that period. Click to pin it open. |
| Sustained shifts | A dashed line marking where the metric moved to a new level and stayed there. Hover over the marker to compare the average before and after the shift. Needs at least 8 periods with data. |
Hover over any other point on the line to see its value, base size, and change from the previous period.
Calendar Heat Map
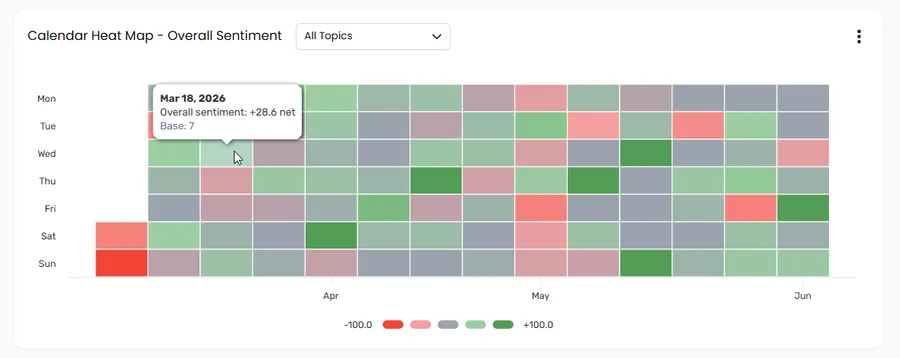
Section titled “Calendar Heat Map”The heat map shows your metric day by day in a calendar grid — days of the week down the side, weeks across. The legend beneath the grid shows the scale.
- For overall sentiment, each cell shows net sentiment (positive % minus negative %). The colours run from red (negative) through grey to green (positive), and the legend shows the lowest and highest values in your data.
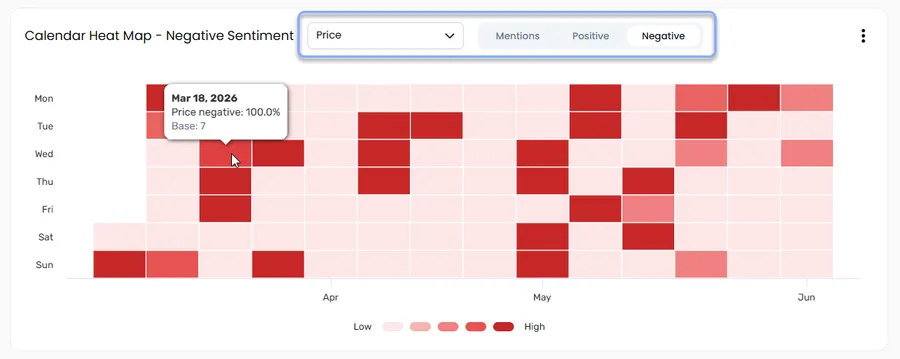
- For a data variable, or a single topic, darker cells mean higher values.
This is where recurring patterns give themselves away. A run of dark cells on the same weekday, week after week, is the kind of signal that’s easy to miss in a line chart but jumps out here — think staffing gaps hitting a retail store every Saturday, or slow response times in a call centre at the start of each month.
Pattern detection
Section titled “Pattern detection”When you’re tracking overall sentiment and viewing All Topics, the heat map tests your data for patterns and tells you what it found above the grid:
- Day of week — whether some days are consistently better or worse than others, for example “Mondays are consistently your worst day for sentiment, while Fridays are your best.”
- Week to week — whether whole weeks stand out, for example the week with the worst sentiment.
When a pattern is significant, an AI-written insight explains it. Open the Significant differences panel beneath the grid to see which days and weeks stood out, with their net sentiment. If there isn’t enough data yet — the test needs a few weeks of feedback across every weekday — the heat map says so.
Viewing a single topic
Section titled “Viewing a single topic”Use the All Topics dropdown to filter the heat map to a single sub topic. This is the fastest way to spot day-of-week patterns or to pinpoint exactly when a change started. Once a sub topic is selected, use the Mentions, Positive, and Negative buttons to see whether it’s how often people raise it, or the good or bad days, driving the trend.
Topic Analysis Summary
Section titled “Topic Analysis Summary”A second AI-written narrative, this time across topics: which topics dominated the conversation, their sentiment breakdowns, and what the recurring themes suggest. The periods being compared are shown under the heading.
Topic names in the summary are links. Click one to jump straight to that sub topic in the Topic Deep Dive table, already expanded.
Topic Deep Dive
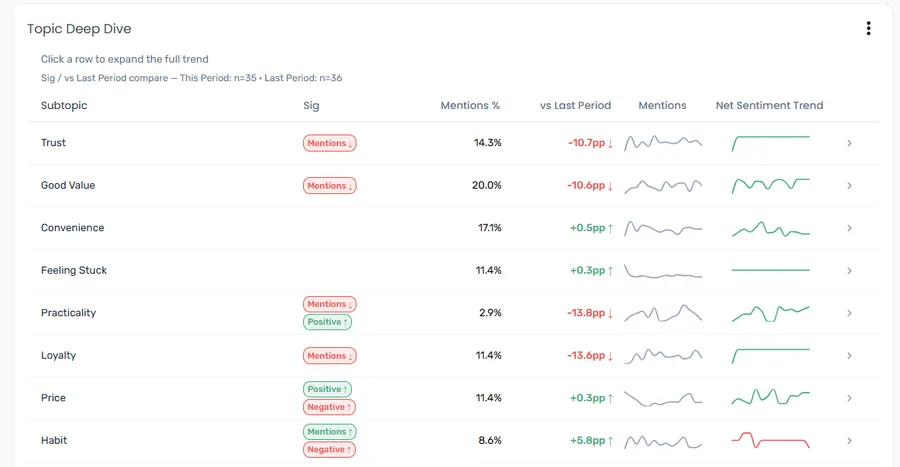
Section titled “Topic Deep Dive”The Topic Deep Dive table gives you the whole tracker at a glance — a row per sub topic showing which are trending up or down in positive or negative sentiment, and flagging where there are interesting subgroup differences worth a closer look. To keep the focus on what’s moved, sub topics with no significant change are tucked away by default; click Show N non-significant subtopics at the bottom of the table to see them. If nothing changed significantly, the table says so and offers Show all N subtopics instead.
| Column | What it shows |
|---|---|
| Subtopic | The sub topic name. A ! marker means at least one subgroup moved significantly on mentions — hover over it to see which filter variables. |
| Sig | Chips flagging a statistically significant change in sentiment since the previous period — for example, Positive +6.2pp ↑ or Negative −4.1pp ↓. Green means good news and red means bad news, so a fall in negative sentiment is green. No chip means no significant sentiment change. |
| Mentions % | The proportion of this period’s comments mentioning the sub topic |
| vs previous period | The change in mentions, in percentage points, or No change. The figure is bold when the change is statistically significant. |
| Mentions | A sparkline of mentions over time |
| Net Sentiment Trend | A sparkline of net sentiment (positive % minus negative %) over time — green when flat or rising, red when falling |
Click any column heading to sort the table by it. The base sizes for both periods are noted above the table.
To build a new Text Auto Report from only the responses that mention a sub topic, click the arrow button (↗) at the end of its row. The row doesn’t expand. See Creating a separate report for a sub topic.
Expanding a topic
Section titled “Expanding a topic”Click any row to expand the full trend for that sub topic.
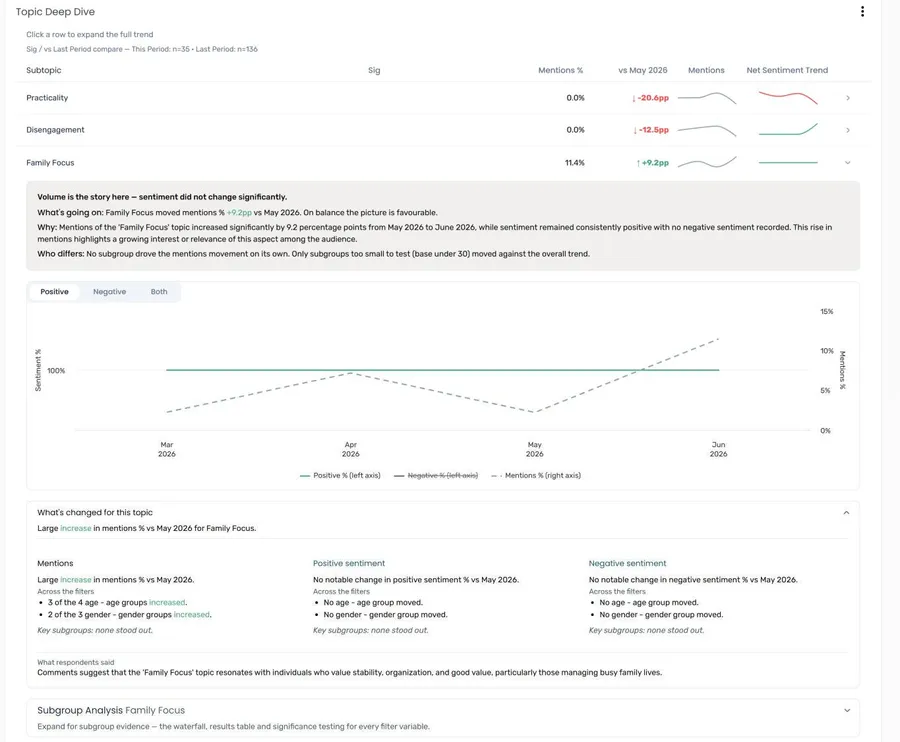
The expanded view contains:
- Summary — a short read on the topic’s story this period:
- a headline saying whether volume or sentiment is the story, or that nothing changed significantly
- What’s going on — how mentions and sentiment moved, and whether the picture is favourable, unfavourable, or mixed
- Why — an AI-written explanation
- Who differs — the subgroups that moved most, and any that moved against the overall trend
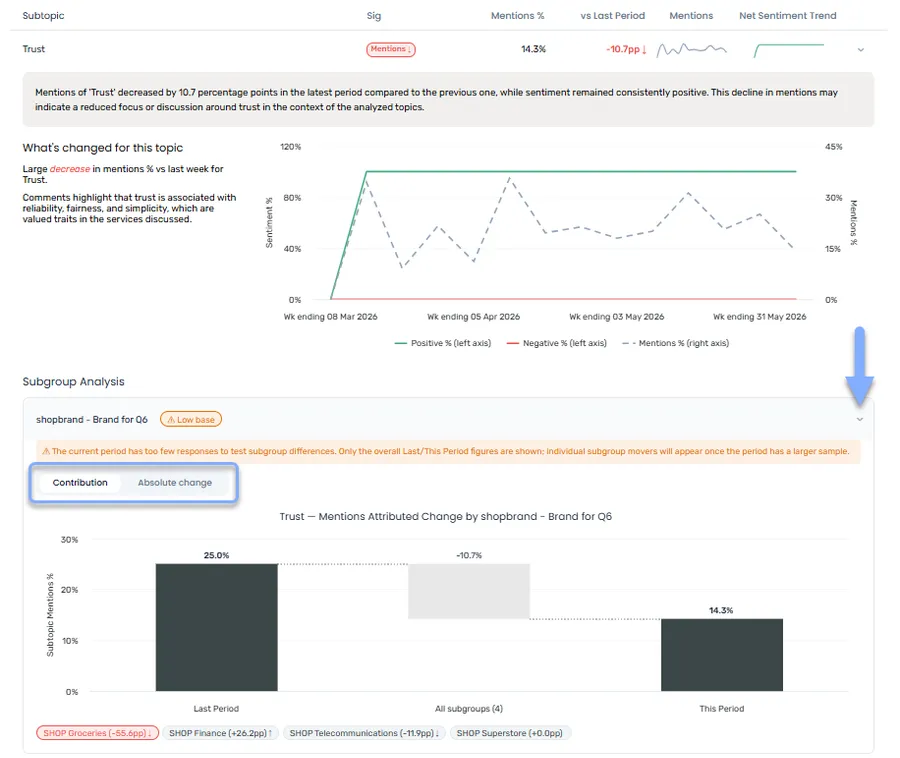
- Trend chart — Positive % and Negative % on the left axis, with Mentions % as a dashed line on the right axis. Mentions sit on their own axis because volume and sentiment are on different scales. Use the Positive, Negative, and Both buttons to choose which sentiment lines to show; your choice carries over as you open other rows. The chart follows the granularity you’ve chosen, so it stays in step with the rest of the tab. Hover over a data point to see specific values.
- What’s changed for this topic — open by default. A sentence summarising the change, then a column each for Mentions, Positive sentiment, and Negative sentiment describing the size of the change (slight, moderate, or large), how subgroups across your filters moved, and the key subgroups. Below that, What respondents said summarises the comments.
- Subgroup Analysis — closed by default. See below.
Subgroup Analysis
Section titled “Subgroup Analysis”For each filter variable in your project (for example, age), the subgroup analysis shows how much each subgroup contributed to the topic’s overall change. Each variable shows a chip such as 2 significant ↑, or ⚠ Low base if its subgroups are too small to test.
Use the Metric switch to choose between Mentions and Sentiment. Choosing Sentiment adds Positive and Negative buttons. Your choice applies to every filter variable at once.
Expand a variable with significant results and choose a view:
| View | What it shows |
|---|---|
| Contribution | A waterfall chart walking from the previous period’s value to this period’s, attributing the movement between subgroups. The top 10 significant subgroups are shown individually; smaller significant changes are grouped as Other Sig and non-significant changes as Non-Sig, so the bars still add up. |
| Absolute change | Each subgroup’s own change in percentage points. These bars don’t add up to the topic total. |
| Results table | Every subgroup’s base and value in both periods, its change in pp, its contribution, and whether the change is significant. Click a row for its full detail. |
In the charts, green and red mean good and bad news, and non-significant subgroups are grey.
Frequently asked questions
Section titled “Frequently asked questions”Why don’t I see a Time Series tab in my report?
Time series wasn’t included for this page. It needs three things from project setup: Time Series chosen as a report type, a date variable in the Filters, Categories & Dates box, and Time Series switched on for the page in the Configure Report Pages step. Use Edit Report to add it to an existing report.
Why can’t I choose a particular time grouping?
When a timeframe is chosen in the filter bar, each grouping needs at least three periods inside it — for example, Yearly needs about three years. Widen or clear the timeframe to see more options. Financial Year also needs to be ticked in the Date Aggregation panel during setup; you can add it with Edit Report.
What does “pp” mean?
Percentage points — the arithmetic difference between two percentages. If mentions moved from 25.0% to 50.0%, that’s a change of +25.0pp (not +100%). Using points keeps period comparisons honest.
What makes a change “significant”?
A change is significant when it passes a statistical test at 95% confidence — a movement unlikely to be random noise given the base sizes. Both periods need at least 30 responses to be tested. A big-looking swing on a small base may not be flagged, and that’s the point: significance protects you from overreacting to noise.
Why doesn’t the trend chart say “Overall Sentiment Trend”?
The chart title reflects the Metric Label you set in the Define Your Measure step. If you tracked a data variable and named it OSAT, that’s what the chart trends. Projects tracking overall sentiment show a sentiment trend instead.
Why is the Sustained shifts switch greyed out?
Sustained shifts need at least 8 periods with data. Try a smaller granularity (for example, monthly instead of quarterly) or widen the timeframe.
Why is the mentions line dashed in the expanded topic chart?
Mentions are plotted on the right-hand axis, separate from the sentiment percentages on the left. The dashed style is a reminder that you’re reading that line against a different scale — a crossing between the mentions line and a sentiment line isn’t meaningful in itself.
Why is there no waterfall chart in Subgroup Analysis?
Either no subgroup changed significantly, or no subgroup had a large enough base (30 or more in both periods) to test. The results table still shows the figures. Try a larger granularity (for example, monthly instead of weekly) to get larger bases per period.
Do the report filters affect the Time Series tab?
Yes. The timeframe, period, and variable filters at the top of the report apply to every section of the tab, and all sections update together.