

Connecting to a data source
You can connect dashboard components to either Data Stores or Explorations created in Data Explorer. We recommend you prepare the variables you’ll need before starting the dashboard build. (See Preparing Data for guidance on what to set up before building.)
Data Stores are what HumanListening uses for importing, storing, and accessing data. Think of them as collections of data fields you can find and use from within HumanListening applications.
Data Explorations are similar to pivot tables in Excel. They’re created in Data Explorer. After connecting to a data store, you can define columns, rows, values, and filters to present the data for each variable in the format you need for the dashboard component.
In a dashboard, filters and verbatim questions connect directly to the data store, but for all other variables, connect to data explorations—they offer much greater flexibility.
The source tiles you see in the Add New Data Source dialog depend on the component. For example, Comments components only offer Data Store. Manual Query is an advanced feature that isn’t available to most users.
Connecting to a data store
Section titled “Connecting to a data store”- Click on the component on the page—an active component will be indicated by a blue header bar
- In the right panel, click on the DATA SOURCE tab
- Click the Add Data Source button
- In the Add New Data Source dialog box, click on the Data Store tile
- Click on the tile containing the name of the data store you want to connect
- Select the variable you want to connect the component to. Only variables of a type the component can use are listed.
- If needed, choose how you’d like to display your data. The available aggregation types are:
- Mean—displays the mean of your chosen variable as a single number
- NPS—groups your data into Net Promoter Score categories (0 to 6, 7 & 8, 9 & 10)
- Percentage—displays your chosen variable in percent format (Single Value Tile and Smile Badge Result only). When selected, you’ll be prompted to choose the values to include or specify a min/max range
- CSat—groups your data into Customer Satisfaction categories (0 to 4, 5 to 7, 8 to 10)
- Categorical—displays your chosen variable in category format (e.g. all codes from your selected question)
- Multi-Response—use this option to format your chart correctly if your source is multi-response data. When selected, you’ll be prompted to choose the values to include
- If needed, choose the values to include
- If you’re asked to Please select supporting variable(s), click the variables you want to add. The message shows how many you can add (for example, Limit: 1). This step appears for most column, bar, line and area charts, among other components. Save stays disabled until you’ve selected at least one.
- Click Save
The available aggregation types depend on the variable type and the component being connected. If an aggregation type isn’t compatible, it’ll appear greyed out. If only one aggregation type is available, it’ll be selected automatically.
Fields that have been excluded from exports and AI in the data store don’t appear in the variable lists.
Connecting to a data exploration
Section titled “Connecting to a data exploration”- Click on the component on the page—an active component will be indicated by a blue header bar
- In the right panel, click on the DATA SOURCE tab
- Click the Add Data Source button
- In the Add New Data Source dialog box, click on the Data Exploration tile
- Click on the tile containing the name of the workspace
- Navigate to and click on the exploration
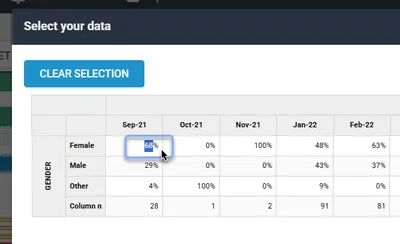
- Select your data:
- For a classic table exploration, all data is included by default — to accept this, simply continue to the next step. To display only part of it, click the cell you want.
- For other explorations, you must select the data you want. Save stays disabled until you click a cell.
- To select more than one cell, hold Ctrl or Shift while you click. You can also click a row or column header to select the whole row or column.
- The Clear Selection button turns blue to show that a selection has been made. Click it to start again.
- Click Save
If you’ve connected to an exploration, you can jump into Data Explorer at any time to work on it. After making changes, preview the dashboard to check the component still displays correctly.
After connecting to a data source, you can click Preview to see your component displaying live data before publishing.
Multiple data sources
Section titled “Multiple data sources”Some components support connecting to more than one data source. The following components can accept multiple data sources:
- Column and Bar charts, including the Stacked and 100% Stacked versions—unlimited data sources
- Line, Spline, Area and Stacked Area charts—unlimited data sources
- TA Bar Chart—unlimited data sources
Pie, Donut, Semi Circle, Item Chart and TA Column Chart take one data source each. The Scatter Plot (up to 2 data sources) and Distribution (up to 4 data sources) components are advanced features that aren’t available to most users.
To add an additional data source, click the Add Data Source button on the DATA SOURCE tab and follow the same connection steps. Each data source appears in its own panel (Data Source: #1, Data Source: #2 and so on) and has its own filter bindings, so bind your filters in each panel. See Binding filters to components.
Editing a data source
Section titled “Editing a data source”Once you’ve connected to a data source, you can’t change which data store, variable, aggregation or exploration it uses. To change these, remove the data source and connect again with the correct settings applied.
You can still change these display settings in the data source’s panel on the DATA SOURCE tab:
- Decimal Places—the number of decimal places shown
- Format with commas—adds thousands separators to numbers
- Suppress Nulls—hides empty values (available for Column, Bar, Pie, Donut and Semi Circle charts)
Removing a data source
Section titled “Removing a data source”Frequently asked questions
Section titled “Frequently asked questions”Can I use an exploration that has stacking or bannering?
Only the Data Exploration component supports explorations with stacking and/or bannering. If you try to connect a stacked or bannered exploration to any other component type, you’ll see the error: “This exploration features Stacking and/or Bannering which are only supported when using the Data Exploration component.”
If you need stacking or bannering in your dashboard, use the Data Exploration component for that particular visualization.
What happens if I delete an exploration in Data Explorer that’s connected to a dashboard?
Any components connected to that exploration will show an error instead of data in the dashboard. When you next open the dashboard in the editor, you’ll see an Unable To Find Data Exploration alert. Connect the affected components to a new data source, and republish.
Do changes to a connected exploration automatically update in the dashboard?
New responses in the underlying data store flow through to the dashboard automatically. If you change the exploration itself, preview the dashboard to check the component still displays correctly, then republish to make sure viewers see the change. If you delete the exploration entirely, see the question above.
How do I prevent rounding inconsistencies between Dashboard Publisher and Data Explorer?
If you’ve set a dashboard component to zero decimal places, you may notice “double rounding”—for example, 8.47% rounds to 8.5% in Data Explorer (at 1 decimal place), then rounds again to 9% in Dashboard Publisher (at 0 decimal places).
To prevent this, set your explorations in Data Explorer to at least 2 decimal places. This gives Dashboard Publisher enough precision to round accurately when you set the component to fewer decimal places.
How do I resolve “Unable To Find Data Exploration”?
You’ll see the message “It looks like one of your Data Explorations has been moved or deleted. Please check your Workspaces” when a connected exploration can no longer be found.
- Open Data Explorer and check that the exploration still exists in its original workspace
- If it was moved, open the dashboard component’s DATA SOURCE tab, remove the old data source, and reconnect to the exploration in its new location
- If it was deleted, you’ll need to either recreate the exploration or connect to a different data source
How do I resolve “Invalid Cell Selection”?
This message only appears when you connect a Smile Badge Result component to an exploration and select a cell containing a count. You’ll see “You have selected a cell containing the count (n) of a variable. Please choose a cell containing an average or a percentage”.
- Remove the data source and click Add Data Source to try again
- Select a cell that contains an average or percentage value rather than a raw count
Why can’t I find a variable in the list?
Variable lists only show the variable types the component can use, so some variables won’t be listed for some components. Fields that have been excluded from exports and AI in the data store are also left out.
If a component was already connected to a field before it was excluded, it shows an error icon instead of data. Remove that data source and connect to a different variable, or contact the data store owner or your administrator if you need the field.