

About components
The Components Menu contains all the elements you need to build a dashboard.
To add a component to your page, just drag and drop it from the menu into position.
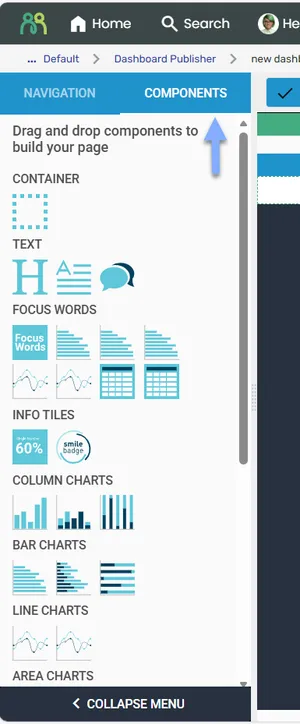
Each component handles different types and formats of data. Let your data direct you to the best component to use, rather than picking components first and trying to connect them to unsuitable data.
Adding a component
Section titled “Adding a component”Select a component from the menu, then drag and drop it into a Container on the page. The target area highlights in green during placement.
Once placed, the component must be connected to a data source — typically an exploration prepared in Data Explorer. See Connecting to a data source for details.
Changing a component type
Section titled “Changing a component type”- Hover over the grey header bar until the move cursor appears, then click.
- In the Properties tab, select the Edit icon next to Component Type.
Editing component properties
Section titled “Editing component properties”Activate the component by hovering over the header bar and clicking — the header turns blue. Modify settings via the Properties tab in the right panel.
Copying a component
Section titled “Copying a component”Click the Copy Me icon in the component header bar to duplicate the component in the same container.
Moving a component
Section titled “Moving a component”Drag components by their header bar to new positions. Green highlighting shows where the component will be placed.
Deleting a component
Section titled “Deleting a component”Click the Remove Me icon in the component header bar.
Available components
Section titled “Available components”Components are grouped in the menu as listed below. Some groups and components are advanced features that are not available to most users, so you may not see every item listed here.
Container
Section titled “Container”- Container — used to divide a dashboard page into sections and manage layout.
- Heading — allows the placement of text headers, for describing a section or displaying quotes or pullout text.
- Paragraph — used to add a body of text for details, descriptions, or captions.
- Comments — used to display open-ended verbatim comments as well as the outputs of various text analytics functions.
Focus Words
Section titled “Focus Words”- Results Drivers — displays results driver analysis from a Focus Words project.
- FW Topic Frequency Bar Chart — displays topic frequency as a bar chart.
- FW Topic Code Frame Stacked Bar Chart — displays topic ratings with code frame stacking.
- FW Topic Average Rating Bar Chart — displays average topic ratings as a bar chart.
- FW Topic Frequency Spline Chart — displays topic frequency over time as a spline chart.
- FW Topic Rating Average Spline Chart — displays rating trends over time as a spline chart.
- FW Topics Overview Table — displays a topic summary table.
- FW Sub Topics Overview Table — displays a sub-topic summary table.
- Focus Areas — places a Focus Words quadrant visualization onto a dashboard page. This is an advanced component that is not available to most users.
Info tiles
Section titled “Info tiles”- Single Value Tile — used for presenting a single data value with optional header and footer.
- Smile Badge Result — used to present the output of Smile Badge survey question types.
Column charts
Section titled “Column charts”- Column Chart — displays answer categories along the horizontal axis and values along the vertical axis.
- Stacked Column Chart — shows comparisons between categories of data, with each column representing a whole, and the segments within the column representing different sub-categories of that whole.
- 100% Stacked Column Chart — used to show relative percentage of multiple data series, where the total of stacked columns always equals 100%.
Bar charts
Section titled “Bar charts”- Bar Chart — displays answer categories along the vertical axis and values along the horizontal axis.
- Stacked Bar Chart — shows comparisons between categories of data, with each bar representing a whole, and the segments within the bar representing different sub-categories of that whole.
- 100% Stacked Bar Chart — used to show relative percentage of multiple data series, where the total of stacked bars always equals 100%.
Line charts
Section titled “Line charts”- Line Chart — displays time series data, with data point markers connected by a line.
- Spline Chart — displays time series data, with data point markers connected by a smoothed line.
Area charts
Section titled “Area charts”- Area Chart — similar to a Line Chart, but with the area below the line filled with color.
- Stacked Area Chart — similar to an Area Chart, but displaying multiple data series that start each point from the point left by the previous data series, so the entire graph represents the total of all the data plotted.
Pie charts
Section titled “Pie charts”- Pie Chart — displays the relation of a part to a whole, or a proportion of one variable in relation to others.
- Donut Chart — similar to a Pie Chart, but with data presented in a ring.
- Semi Circle — similar to a Donut Chart, but with data presented in a half circle corresponding to 100%.
- Item Chart — values are represented as individual dots in a circular arrangement.
Heat map
Section titled “Heat map”- Heat Map — shows where survey respondents clicked on an image, using a Heatmap question.
- Table — displays data in a tabular format with rows and columns. This is an advanced component that is not available to most users.
Data Explorer explorations
Section titled “Data Explorer explorations”- Data Exploration — allows you to place a Data Explorer table onto a dashboard page.
Text analytics
Section titled “Text analytics”- Text Explorer Output — places an output from Text Explorer onto a dashboard page. Choose the output with Select Output.
- Text Auto Report Output — places a Text Auto Report onto a dashboard page. Choose the project, and use Filters Mapping to link dashboard filters to the report.
- TA Column Chart — used to display the incidence of tagged terms from text data. Works with Noun Chunks, Parts of Speech, and Danger Words output. Displays values along the vertical axis, ranked in descending order.
- TA Bar Chart — used to display the incidence of tagged terms from text data. Works with Noun Chunks, Parts of Speech, and Danger Words output. Displays values along the horizontal axis, ranked in descending order.
- External Content URL — embeds a web page, or an HTML file from File Bank, in a dashboard page.