

Cause & Effect (Beta)
The Cause & Effect tab tells you what drives your outcome — the sub topics that most separate people with a good outcome from everyone else. Use it to decide where to act first: which issues to fix, and which strengths to protect.
The tab has two parts:
- Drivers — ranks the sub topics that best predict your outcome group, and lets you open any sub topic to see why it matters.
- Impact Map — shows how sub topics relate to and affect each other. See Impact Map.
Turning on Cause & Effect
Section titled “Turning on Cause & Effect”Cause & Effect is set up in the project set-up wizard:
- In Pick Your Report Type, turn on Cause & Effect.
- In Define Your Measure, choose your outcome measure — Overall Sentiment, or a Data Variable such as NPS or OSAT.
- In Configure Report Pages, turn on Cause & Effect for each page you want it on, with Driver Analysis, Impact Map, or both.
See Set up a project for the full steps. To add it to an existing report, use Edit Report.
Your outcome groups
Section titled “Your outcome groups”Driver Analysis compares two groups of respondents, based on your measure:
| Measure | The two groups |
|---|---|
| Overall Sentiment | Groups based on the sentiment of what people wrote |
| Data Variable reported as Range | Your In Group (for example, Promoters) and your Out Group (for example, Detractors, or everyone else) |
| Data Variable reported as Mean | Responses above the mean and responses below it |
Throughout the tab, the first group is called your outcome group, and the second is the comparison group.
Drivers
Section titled “Drivers”The Drivers card shows the sub topics that best predict whether someone is in your outcome group — for example, what separates Promoters from Detractors.
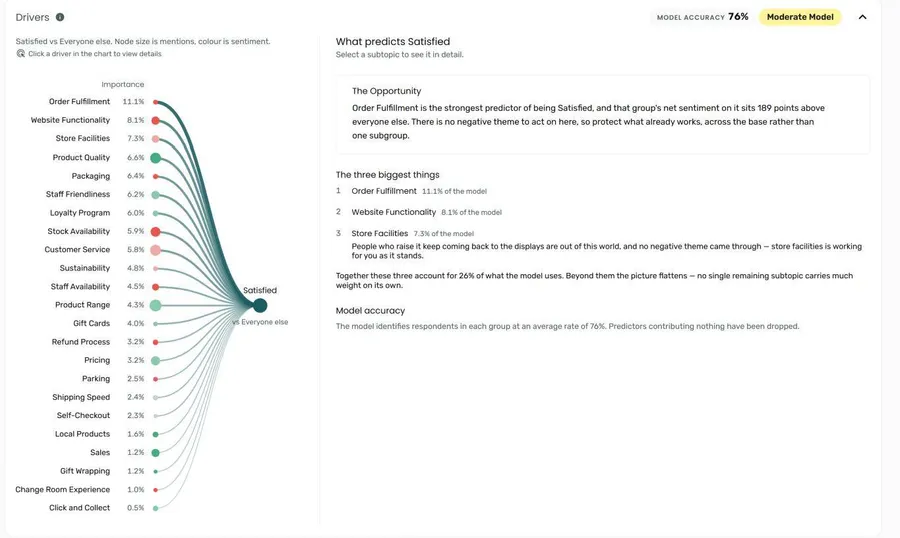
The driver model is built when you first open the tab. While it runs, the card shows Building the model… and Writing the summary…. If it takes longer than expected, open the tab again later.
Model accuracy and strength
Section titled “Model accuracy and strength”Two pills in the card header tell you how much to trust the ranking:
| Pill | What it means |
|---|---|
| Model accuracy | How often the model correctly predicts which group a respondent is in, averaged across the two groups |
| Strong Model, Moderate Model, or Weak Model | How reliable the ranking is, based on the model’s accuracy |
When the model is weak, a note above the chart reminds you to read the ranking as an indication of what matters rather than a precise order. If the model isn’t reliable enough to report on at all, the drivers aren’t shown.
Driver chart
Section titled “Driver chart”The chart ranks every sub topic that contributes to the model, most important first. Each sub topic shows its Importance — how much of the model’s prediction it accounts for.
- The size of each sub topic’s circle shows how many people mentioned it.
- The colour shows its net sentiment.
Hover over a sub topic to see its importance, how many people mentioned it, and its net sentiment. Click a sub topic to open its details.
What predicts your outcome
Section titled “What predicts your outcome”Before you open a sub topic, the panel beside the chart summarises the model:
- The Opportunity — a suggested next step, based on the strongest driver.
- The three biggest things — the top drivers, with how much of the model each accounts for and the positive and negative themes behind them.
- Model accuracy — how well the model identifies respondents in each group.
Sub topic details
Section titled “Sub topic details”Click a sub topic in the driver chart to see it in detail. To return to the overview, click the X beside the sub topic’s name, or click the same sub topic in the chart again.
The details start with The Opportunity for that sub topic and a set of figures:
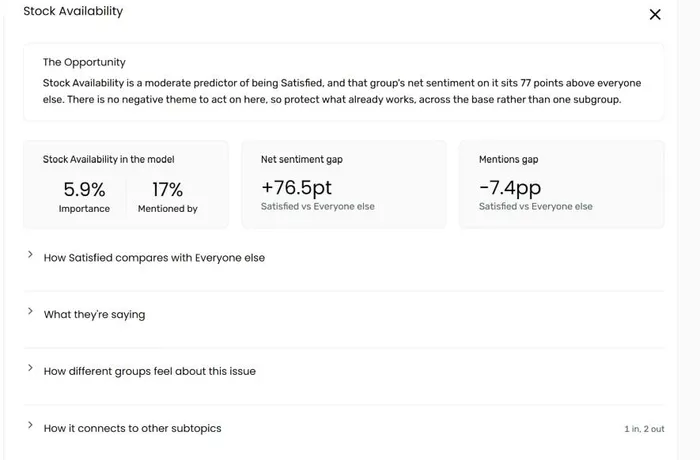
| Figure | What it shows |
|---|---|
| Importance | How much of the model’s prediction this sub topic accounts for |
| Mentioned by | The percentage of respondents who mentioned it |
| Net sentiment gap | How much more positive or negative your outcome group is about it than the comparison group, in points |
| Mentions gap | How much more or less often your outcome group mentions it than the comparison group, in percentage points |
Below the figures are sections you can open and close. Each starts closed; a section you open stays open as you move between sub topics.
How your outcome group compares
Section titled “How your outcome group compares”A bar for each group, showing how the people in that group who mentioned the sub topic felt about it — positive, mixed, neutral, and negative. Each bar shows the group’s mentions, net sentiment, and base. Hover over a segment to see its percentage.
Groups with fewer than 10 mentions aren’t broken down, because the base is too small.
What they’re saying
Section titled “What they’re saying”Quotes from your outcome group about the sub topic, split into Negative about it and Positive about it, with a sentence summarising which way opinion runs.
How different groups feel about this issue
Section titled “How different groups feel about this issue”A quadrant chart showing how subgroups in your filter variables — for example, age or region — differ on this sub topic. It only appears when your report has filter variables.
- The vertical axis shows the mentions difference between your outcome and comparison groups.
- The horizontal axis shows the net sentiment difference.
Each subgroup falls into one of four quadrants:
| Quadrant | What it means |
|---|---|
| Priority | Your outcome group raises it more, and feels worse about it |
| Strength | Your outcome group raises it more, and feels better about it |
| Watch | Your outcome group raises it less, but still feels worse about it |
| Settled | Your outcome group raises it less, and feels better about it |
Use Relative quadrants (the default) to compare each subgroup with this sub topic’s overall difference, or Absolute quadrants to compare it with no difference between the groups. Turn on Show significant only to hide subgroups whose differences are too small to be sure of — otherwise they’re shown faded.
Click a subgroup to see a summary of how it differs. Click a variable in the legend to hide or show its subgroups. Subgroups with too few mentions aren’t plotted; the paragraph above the chart tells you how many.
How it connects to other subtopics
Section titled “How it connects to other subtopics”A diagram showing which sub topics influence this one (Impacted by) and which it influences (Impacts on), based on the Impact Map. It only appears when the page has an Impact Map.
Impact Map
Section titled “Impact Map”Below the Drivers card, the Impact Map card shows how sub topics relate to and affect each other across your whole data set. See Impact Map for how to read it.
Frequently asked questions
Section titled “Frequently asked questions”Why don’t I see a Cause & Effect tab?
Cause & Effect wasn’t included for this page. Use Edit Report to turn it on — see Turning on Cause & Effect. If the report has only one tab, the tab row isn’t shown at all.
Why does my Cause & Effect tab only show the Impact Map?
Only Impact Map was turned on for this page, not Driver Analysis. Reports created before Cause & Effect was released also show their Impact Map here, without drivers.
What does “Weak Model” mean?
The model can tell the two groups apart, but only modestly. The sub topics at the top of the ranking still matter, but don’t read too much into the exact order. A weak model can happen when the two groups talk about similar things, or when there isn’t much data.
Why does it say the model isn’t reliable enough to report on?
The model couldn’t predict which group respondents are in much better than chance, so the drivers aren’t shown. This usually means what people wrote doesn’t clearly differ between your two groups. Try a different measure, or wait until you have more data.
What’s the difference between Drivers and the Impact Map?
Drivers tells you which sub topics best predict your outcome — for example, what separates Promoters from Detractors. The Impact Map shows how sub topics influence each other, regardless of outcome. Use Drivers to decide what to act on, and the Impact Map to understand the knock-on effects.
Is Cause & Effect included in the PowerPoint export?
The Drivers card isn’t included in the PowerPoint export.