

Dashboard filters
Filters are a specialized type of component which allow users to control which data displays on the page, based on its underlying data. All filters will appear at the top of the published dashboard. When a user selects the values for each filter, then clicks the Apply button, all dashboard components that have been connected to those filters will automatically update.

To reset filters to their default values, click the Clear button.

Adding dashboard filters
Section titled “Adding dashboard filters”There are two ways to add a filter:
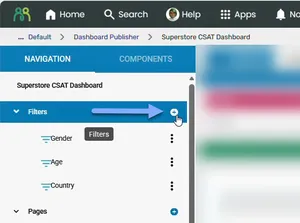
- In the Navigation Menu, click the Add icon in the Filters section.
- In the middle panel Filters header bar, click the Add Filter icon.

The Add Filter dialog will guide you through the following settings:
- Name — the name of the filter. It’s displayed in the Navigation Menu in the Dashboard Publisher editor, and is also used as the filter’s label in the published dashboard.
- Choose a Data Source — select from the available data stores.
- Choose the variable that contains the values for the filter — only Number, Text, Integer and Multi-Response variables are listed. You can have explorations from more than one data store on your dashboard page, but unless they all contain the same variable that you have chosen, they won’t be bound.
- Select the variable you would like to use to label the filter — this can be the same as the variable you chose before. This step only appears if the variable you have chosen in the previous step doesn’t have a code frame.
- Allow All — lets the user choose to select all options.
- Multi Select — allows the user to select one or more options. Multi-select filters can be mapped to most Focus Words components, but not to the Results component when it’s set to Results V1.
- Is Bindable — the filter is able to be bound to items on the page. This is on by default.
- Exclude 99 — treats responses coded 99 as missing, so they’re left out of the results for components bound to this filter. Use this when 99 is the code for an answer such as “Don’t know”. It doesn’t remove other missing values.
Advanced users may also see Label (the label shown in the published dashboard) and Key Field (the filter’s unique field name). For everyone else, these are set automatically from the Name.
Once a filter has been added, the settings can be edited via the Properties Menu in the right panel.
Copying an existing dashboard filter
Section titled “Copying an existing dashboard filter”There are two ways to copy a filter:
- Click the more icon (⋮) next to the filter you want to copy, then select Duplicate from the menu.
- Click the Copy Me icon in the middle panel.
The TimeFrame and Period filters can’t be copied.
Deleting a dashboard filter
Section titled “Deleting a dashboard filter”There are two ways to delete a filter:
- Click the more icon (⋮) next to the filter you want to delete, then select Remove from the menu.
- Click the Remove Me icon in the middle panel.
If you delete a filter by mistake, click the Undo button to immediately undo the deletion.
To remove the TimeFrame and Period filters, turn off Enable Timeframe Filtering (see Timeframe filtering).
Reordering dashboard filters
Section titled “Reordering dashboard filters”In the Filters section in the middle panel, simply drag and drop the filter components until they are in the desired order.
Renaming dashboard filters
Section titled “Renaming dashboard filters”To rename a filter:
- In the Navigation Menu in the left panel, select the filter you want to rename.
- In the right panel Properties Menu, click on Name.
- Enter the new name into the Name field.
The filter’s label in the published dashboard is updated to match the new name.
Binding filters to components
Section titled “Binding filters to components”Bind to all
Section titled “Bind to all”- Click on the filter in the Navigation Menu.
- In the Properties Menu, click the Bind To All button. This button only appears when Is Bindable is turned on.
Individual binding
Section titled “Individual binding”Filters are bound to each of a component’s data sources separately.
- Click on the component on the page.
- In the right panel, click on the DATA SOURCE tab.
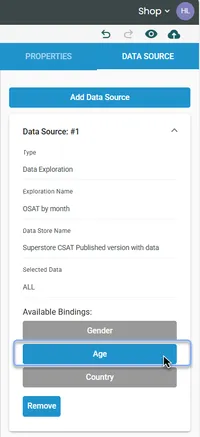
- Each data source has its own panel (Data Source: #1, Data Source: #2 and so on). In the Available Bindings section of each panel, click on each filter you want to be bound to that data source.
A filter that the data source is bound to is indicated by blue — when the user applies this filter in the published dashboard, the component will automatically update to only display data relevant to the selected filter criteria. Where the filter is not bound (indicated by grey), any change applied to the filter criteria will have no effect on that data source.
If a component has more than one data source, remember to bind the filter in each data source panel.
Timeframe filtering
Section titled “Timeframe filtering”To enable timeframe filtering:
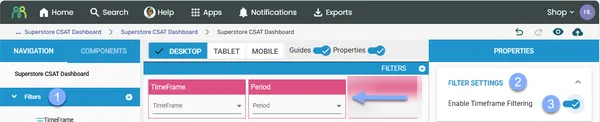
- In the Navigation Menu in the left panel, click on Filters.
- In the Properties Menu in the right panel, click on Filter Settings.
- Click the Enable Timeframe Filtering toggle.
The timeframe dialog will guide you through the following steps:
- Select the time frames to include — week, month, quarter, year, and/or financial year, and enable rolling periods as required.
- If you select the weekly time frame, choose the day the week ends on from the Type dropdown.
- If you select financial year, choose when the financial year starts from the Type dropdown.
- Choose your data store — select from the available data stores.
- Select your date variable — select from the available date variables in your selected data store.
- Select your start date — the timeframe filter options will be scoped based on the selected Start Date and time frames.
The timeframe filter will be added to the Filters section of the Navigation Menu and the Filters section in the middle panel, and will be available for binding to dashboard components.
Rolling periods
Section titled “Rolling periods”In the timeframe filtering dialog, check the Rolling Periods box. When rolling periods are on, you can only select one time frame.
Enter the Number of Periods you want to combine (e.g., enter 3 for a 3-month rolling period — the results for the current month will be combined with the 2 previous months). Then use the Labels dropdown to select how you want the dates to be labeled:
- End Points — will include the whole date range in the label.
- Last Point — will only display the final period in the range.
Click Next, then select the data store, date variable, and start date, and click Next. Bind dashboard components to the timeframe filters as required.
Nested filters
Section titled “Nested filters”Nested filters are set up via parent and child filters. For example, say you want to set up a parent filter (country) and a child filter (state), where the state filter shows only the states from the selected country filter. If you bound a chart only to the state filter, and not the country filter, when a user selects Australia, the data would still be global, because the state filter would still say “ALL.”
To set up nested filters:
- Select the filters in the Navigation Menu (or in the Filters section of the middle panel).
- In the Properties Menu, select the parent filter from the Available Parents.
- Select the child filters from the Available Children.
Connecting dashboard to Focus Words filters
Section titled “Connecting dashboard to Focus Words filters”The Filters Mapping function in Dashboard Publisher allows you to map filters you use in your dashboard to the filters in any Focus Words project (using the same source data) you embed in it.
To connect dashboard filters to Focus Words:
- Drag and drop the Focus Words component onto your dashboard page.
- Click on Focus Words Settings in the Properties tab.
- Select the Focus Words project you are planning to visualize via the Project dropdown.
- Click the Filters Mapping button. This button only appears once a project is selected and your dashboard has at least one filter. The Pair Filters dialog opens.
- If you have timeframe filters active in your dashboard, these will automatically be paired with the Focus Words project, with no further action required.
- For other filters, click the Select Focus Words Filter dropdown to set the target filter, then select the corresponding dashboard filter using the Select Dashboard Filter dropdown. Click Add — the new filter pair will now be listed in the dialog box.
- Once you have followed these steps for each of the pairs of filters you wish to map, click Save to commit your changes.
- Preview or publish your dashboard to make sure the filters are working as expected.
Managing filter pairs
Section titled “Managing filter pairs”In the Pair Filters dialog:
- Reorder pairs by dragging the rows in the list.
- Delete a pair by clicking its delete (bin) icon.
- TimeFrame and Period pairs are added automatically and can’t be deleted.
Connecting dashboard to Text Auto Report filters
Section titled “Connecting dashboard to Text Auto Report filters”You can also map dashboard filters to the filters in a Text Auto Report, so the embedded report updates when viewers change the dashboard filters.
- Drag and drop the Text Auto Report Output component onto your dashboard page.
- In the Properties tab, click Settings and select the report via the Project dropdown.
- Click the Filters Mapping button. This button only appears once a project is selected and your dashboard has at least one filter. The Pair Filters dialog opens.
- Click the Select Text Auto Report Filter dropdown to set the target filter, then select the corresponding dashboard filter using the Select Dashboard Filter dropdown. Click Add.
- Repeat for each pair of filters, then click Save.
- Preview or publish your dashboard to make sure the filters are working as expected.
Keep in mind:
- Text Auto Report filters are categorical only. They can’t be paired with dashboard filters that use text variables, or with the TimeFrame and Period filters. Dashboard filters that use text variables are listed under Excluded Dashboard Filters in the dialog.
- Mapped filters are hidden in the report. Viewers control them using the dashboard filters instead.
- If a filter combination can’t be shown, the report displays a Filter Gone Rogue! message: “We can’t display this filter combination right now.” Check your filter pairs, or contact your account admin or support.
Frequently asked questions
Section titled “Frequently asked questions”What does the “Bind To All” button do?
Clicking Bind To All on a filter will bind that filter to every available component across all pages in the dashboard. You’ll see a confirmation: “This filter will be bound to all available items across all pages. Are you sure you want to do this?” This is a quick way to apply a filter globally, but you can always unbind individual components afterwards if needed.
How can I avoid “Save Failed” errors when binding filters?
When manually binding or unbinding multiple filters to a component, work at the pace of the autosave to avoid conflicts:
- Click on the first filter you want to bind or unbind.
- Move to the next filter and click, but don’t release the mouse button yet.
- Keep holding the mouse button and release when you see the “Save Success” notification.
- Repeat for each remaining filter.
This rhythm ensures each change is saved before the next one is made.
Can I increase the width of a filter dropdown?
Yes. Add the following CSS to your Dashboard Settings, replacing the filter ID with your own:
.dashboard-filter-screen-size-md[filter-id="your-filter-id-here"] \{ flex-basis: 400px;\}This sets the specified filter to 400px wide. You can find the filter ID by inspecting the filter element in your browser, or ask your administrator for help.
How can I filter out incompletes from my dashboard?
To exclude incomplete survey responses from your dashboard:
- Create a dashboard filter using sys_finishmarkerid as the variable.
- Bind the filter to all components that should exclude incomplete data.
- To show only complete responses when viewers first open the dashboard, the filter needs a default value of “Finished Successfully”. Setting a filter default is an advanced feature that isn’t available to most users, so contact your administrator for help.
If you don’t want viewers to change this filter, you can turn off Show Filter Bar in Page Settings for the pages where it applies. This hides all filters on that page, not just this one.
Why are my nested filters not working or causing the dashboard to lock up?
Check the following:
- Check the parent and child settings — a filter can’t have the same filter as both its parent and its child. If it does, you’ll see a warning when you publish.
- Check your bindings — bind components to both the parent and child filters, so a selection in either one updates the data.
- Recreate the filters if needed — delete the affected filters and add them again.
Why can’t I find a variable when I add a filter?
The Add Filter dialog only lists Number, Text, Integer and Multi-Response variables. Fields that have been excluded from exports and AI in the data store are also left out, and don’t appear when you add a filter or a timeframe filter.
If a filter was already using a field before it was excluded, it shows an error icon instead of its options in the dashboard. This also applies to Focus Words filter mappings that use an excluded field. Remove the filter, or contact the data store owner or your administrator if you need the field.