

Dashboard Publisher
Dashboard Publisher lets you create engaging dashboards to present real-time output from your surveys and data explorations—and share them with your team.
You’ll use drag-and-drop elements to build out your layout and link to the data you want to visualize. Think of it as your command center for insights: pull in what matters, arrange it beautifully, and let the data tell its story.
Dashboards can contain multiple pages and display charts, callout tiles, comments, and Text Auto Reports.
Each dashboard component has customizable properties so you can create exactly the look and feel you want.
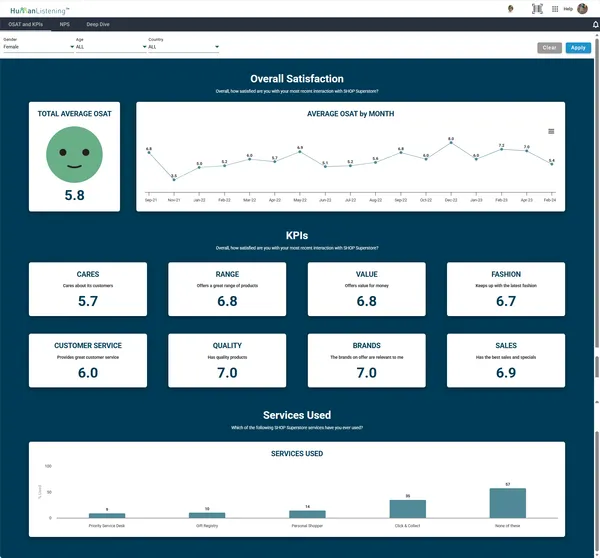
Dashboards are responsive and automatically scale to fit devices like tablets or mobile phones—your insights look great everywhere.
The basic workflow
Section titled “The basic workflow”Here’s the typical journey from data to dashboard:
- Prepare the data source
- Add a new dashboard
- Add components to dashboard pages
- Edit component display properties
- Connect chart and comment components to a data source
- Apply styles
- Check layout in Desktop, Tablet, and Mobile modes
- Add more dashboard pages
- Apply dashboard filters
- Preview the dashboard
- Publish the dashboard
- Share the dashboard
Building a dashboard is an iterative process, so you’ll revisit most of these steps more than once. Don’t worry about following the exact order—jump around as needed.
Opening Dashboard Publisher
Section titled “Opening Dashboard Publisher”There are several ways to open Dashboard Publisher:
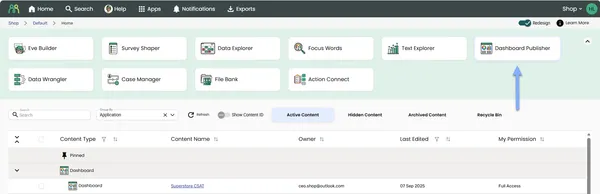
- Application grid — On the portal home page, click the Dashboard Publisher card in the application grid
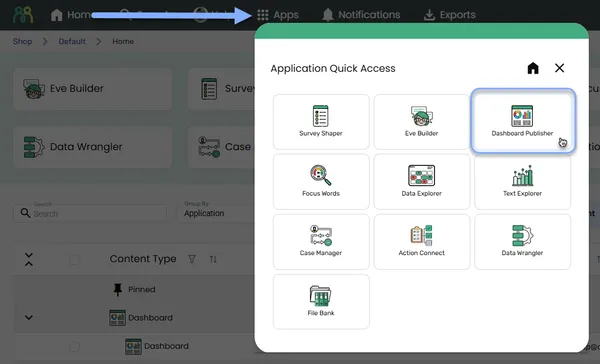
- Application quick access — Click the Apps button in the header bar, then select Dashboard Publisher from the quick access dialog
Dashboard Publisher content table
Section titled “Dashboard Publisher content table”When you open Dashboard Publisher, you’ll see the content table listing all dashboards you’ve created or that have been shared with you:
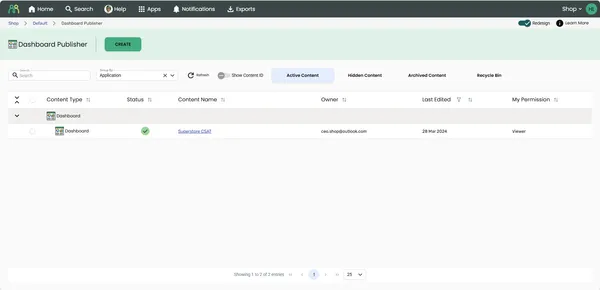
The content table displays the following columns:
| Column | Description |
|---|---|
| Content Type | The type of content (Dashboard Project) |
| Status | The publish status of the dashboard |
| Content Name | The name of the dashboard — click to open it in the editor |
| Owner | The email address of the dashboard owner |
| Last Edited | The date the dashboard was last modified |
| My Permission | Your access level (Owner, Viewer, etc.) |
Publish status
Section titled “Publish status”The Status column shows whether a dashboard is published. Hover over the icon to see its status:
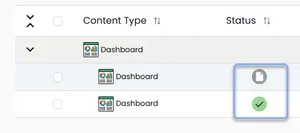
- Draft — the dashboard isn’t published yet, or has been unpublished
- Published (green checkmark) — the dashboard is published and live
Content tabs
Section titled “Content tabs”Use the tabs above the content table to filter what is displayed:
- Active Content — dashboards currently in use (default view)
- Hidden Content — dashboards you’ve hidden from your default view (hiding only affects your own view, not other users’)
- Archived Content — dashboards that have been archived
- Recycle Bin — dashboards that have been deleted. They can be restored for 30 days, after which they’re permanently removed
Row actions
Section titled “Row actions”Hover over any dashboard row to reveal these action icons:
- View — open the dashboard in the Dashboard Publisher editor
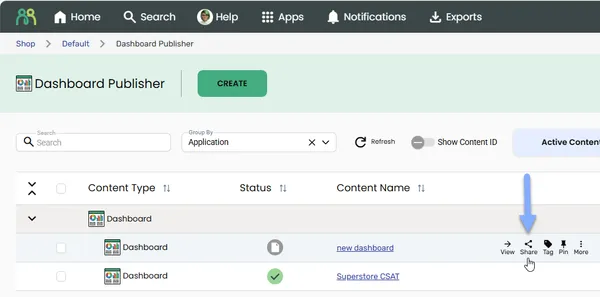
- Share — share the dashboard with other users
- Tag — add tags to the dashboard
- Pin — pin the dashboard for quick access
- More (⋮) — access additional options:
- Edit, Rename, Duplicate, Hide, Archive and Delete
- View Live — open the live dashboard (published dashboards only). See Publishing.
- Unpublish — take the live dashboard offline (published dashboards only, editors only). See Publishing.
- Subscribe / Unsubscribe — turn notifications for the dashboard on or off
- Notification preferences — choose which notifications you receive (shown once you’re subscribed)
In the Recycle Bin tab, the More menu offers Restore and Permanently Delete instead.
Creating a new dashboard
Section titled “Creating a new dashboard”- Open Dashboard Publisher using one of the methods above.
- Click the CREATE button.
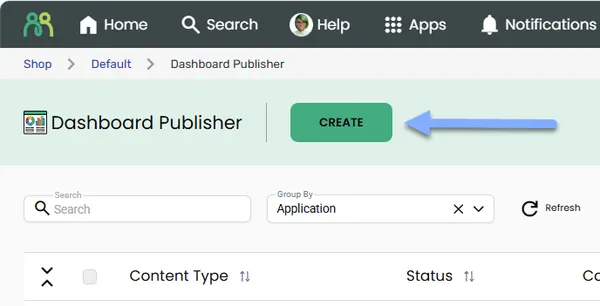
- Enter a name for your new dashboard and click OK.
This opens the Dashboard Publisher editor where you’ll build your dashboard.
Duplicating an existing dashboard
Section titled “Duplicating an existing dashboard”You can also create a new dashboard by duplicating an existing one:
- Open Dashboard Publisher.
- Hover over the dashboard you want to copy and click the more icon (⋮).
- Select Duplicate from the menu.
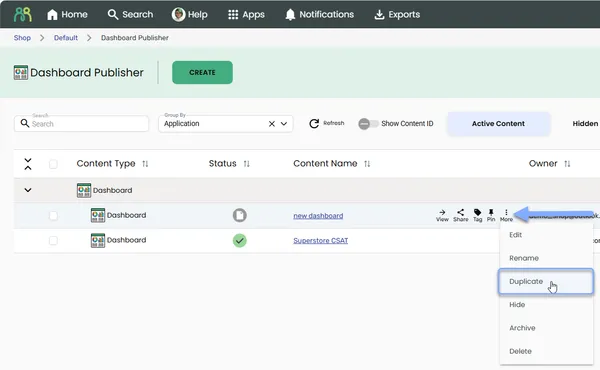
A copy called “dashboard name - Copy” is created straight away as a Draft. Use Rename from the more menu if you want to give it a different name.
Working with existing dashboards
Section titled “Working with existing dashboards”Opening a dashboard
Section titled “Opening a dashboard”Once you’ve created a dashboard, there are a few ways to get back into it:
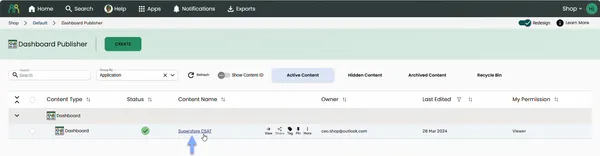
- From Dashboard Publisher — Open Dashboard Publisher and click the dashboard name (or the View icon) in the content table
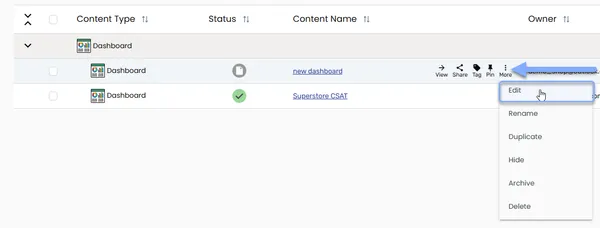
- From Dashboard Publisher (more menu) — Open Dashboard Publisher, hover over the dashboard and click the more icon (⋮), then select Edit
- From Portal home — Hover over the Dashboard Project in the Portal home content table and click the more icon (⋮), then select Edit
Sharing a dashboard
Section titled “Sharing a dashboard”To share a dashboard from the content table, hover over the dashboard row and click the Share icon:
For full details on sharing, see Share dashboard.
Archiving a dashboard
Section titled “Archiving a dashboard”To archive a dashboard you don’t need in your active list anymore:
- Hover over the dashboard in the content table and click the more icon (⋮).
- Select Archive from the menu.
The dashboard moves to the Archived Content tab.

Restoring an archived dashboard
Section titled “Restoring an archived dashboard”To restore an archived dashboard:
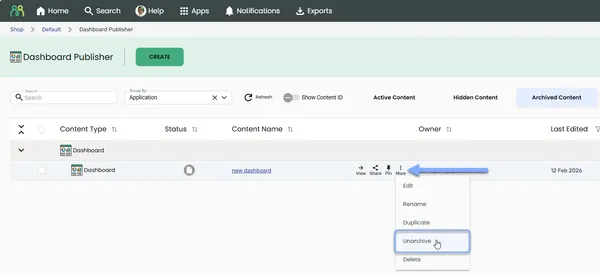
- Click the Archived Content tab.
- Hover over the dashboard and click the more icon (⋮).
- Select Unarchive from the menu.
The dashboard moves back to Active Content.
Deleting a dashboard
Section titled “Deleting a dashboard”Only the dashboard owner can delete a dashboard.
- Hover over the dashboard in the content table and click the more icon (⋮).
- Select Delete from the menu.
There’s no confirmation step. The dashboard moves straight to the Recycle Bin tab, where it’s kept for 30 days before being permanently removed.
Restoring a deleted dashboard
Section titled “Restoring a deleted dashboard”- Click the Recycle Bin tab.
- Hover over the dashboard and click the more icon (⋮).
- Select Restore from the menu.
The dashboard moves back to Active Content.
Permanently deleting a dashboard
Section titled “Permanently deleting a dashboard”To remove a dashboard from the Recycle Bin straight away, without waiting 30 days:
- Click the Recycle Bin tab.
- Hover over the dashboard and click the more icon (⋮).
- Select Permanently Delete from the menu.
- Type
DELETEto confirm.
Tour of the editor workspace
Section titled “Tour of the editor workspace”When you open a dashboard for editing, here’s what you’ll see:
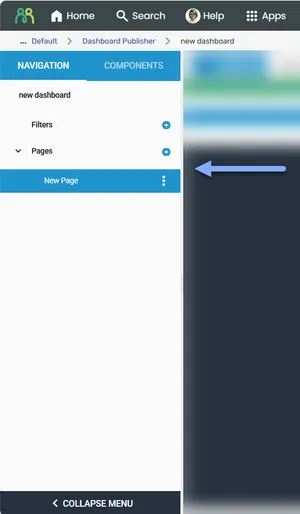
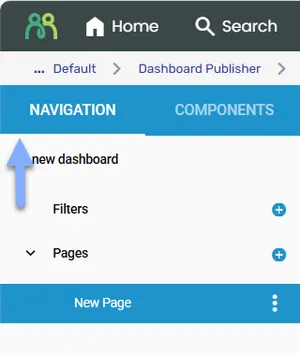
Left panel
Section titled “Left panel”Contains the Navigation Menu and Components Menu. Click Collapse Menu at the bottom of the left panel to minimize it and free up workspace. To restore the panel, click the Maximize Navigator icon.
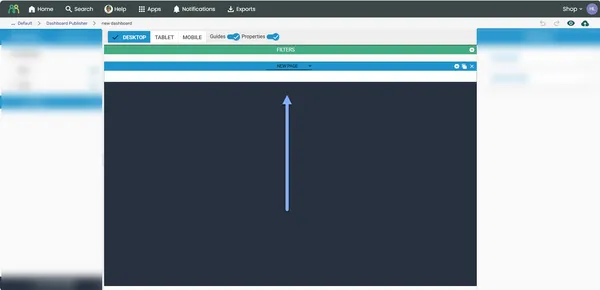
Middle panel
Section titled “Middle panel”Contains the dashboard page where you’ll drag and drop components to build your layout. To switch between pages, click the page in the Navigation Menu. When Guides are turned off, you can also switch pages using the navigation dropdown at the top center.
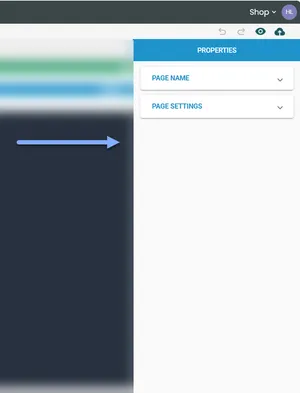
Right panel
Section titled “Right panel”Contains the Properties Menu and Data Source Menu. The DATA SOURCE tab only appears when you select a component that can be connected to data, or a page that has low base blocking turned on.
Layout bar
Section titled “Layout bar”- Switch between Desktop, Tablet, and Mobile modes to see how your page looks on different devices.
- Use the Guides toggle to hide all the guides for a clean view of your dashboard. This also hides the left panel—switch guides back on and click the Maximize Navigator icon to restore it. Note: you can’t edit the page when guides are hidden.
- Use the Properties toggle to show or hide the right panel whenever you need it.

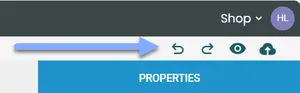
Header bar
Section titled “Header bar”- Contains Undo and Redo buttons.
- Click the Preview button to view your latest saved changes in a new tab. If the dashboard has never been published, Preview publishes it first. See Publishing.
- Click the Publish button to open the publish menu, where you can publish the dashboard.
Navigation menu
Section titled “Navigation menu”The Navigation Menu lists all the filters and pages you’ve added to your dashboard. You can add, edit, and remove these elements here.
If you have access to the advanced Roles feature, roles are also listed here. Most users won’t see Roles. For more information, see Dashboard roles.
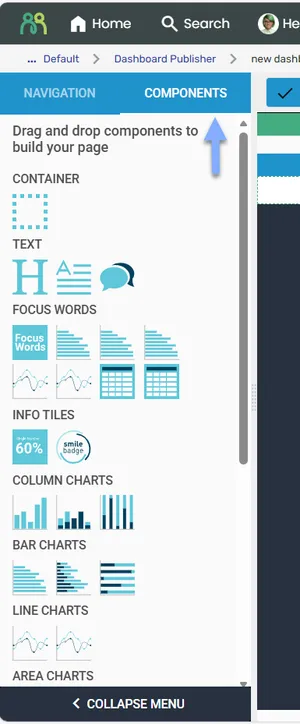
Components menu
Section titled “Components menu”The Components Menu contains all the elements you need to build a dashboard.
To add a component to your page, just drag and drop it from the menu into position.
Properties menu
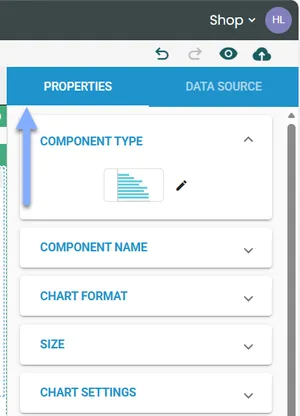
Section titled “Properties menu”The Properties Menu contains all the settings for each component in your dashboard. To access it, click the component you want to edit—the available properties appear in the right panel. Properties are organized into collapsible sections, so click a section to see what you can edit.
The available properties change depending on the component type you’re editing. For details about each property, see the individual component pages in About components.
Editing dashboard properties
Section titled “Editing dashboard properties”- Click the Navigation Menu in the left panel.
- Click the dashboard name.
- In the Properties Menu in the right panel, click Dashboard Settings.
- Edit the settings as needed—your changes autosave.
Editing filter properties
Section titled “Editing filter properties”To edit overall dashboard filter settings:
- Click the Navigation Menu in the left panel.
- Click Filters.
- In the Properties Menu in the right panel, click Filter Settings.
- Edit the settings as needed—your changes autosave.
To edit individual filter properties:
- Click the Navigation Menu in the left panel.
- Click the dropdown arrow next to Filters.
- Click the filter you want to edit.
- In the Properties Menu in the right panel, click the setting you want to edit.
- Edit the settings as needed—your changes autosave.
Editing page properties
Section titled “Editing page properties”- Click the Navigation Menu in the left panel.
- Click the dropdown arrow next to Pages.
- Click the page you want to edit.
- In the Properties Menu in the right panel, click the setting you want to edit.
- Edit the settings as needed—your changes autosave.
Editing component properties
Section titled “Editing component properties”- Click the component on the page—an active component shows a blue header bar.
- In the Properties Menu in the right panel, click the setting you want to edit.
- Edit the settings as needed—your changes autosave after every change.
Data source menu
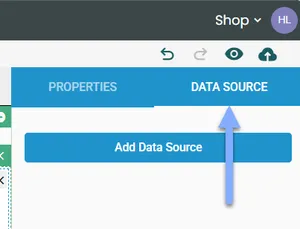
Section titled “Data source menu”The Data Source Menu lets you connect a dashboard component to a data source and choose which filters to bind to the component. To access it, click the component you want to edit, then click the DATA SOURCE tab in the right panel. The tab only appears for components that can be connected to data.
Saving a dashboard
Section titled “Saving a dashboard”Dashboard Publisher autosaves every change you make. Each save is confirmed by a “Save Success” message at the bottom of the screen.
Undoing changes
Section titled “Undoing changes”To undo a change made in error, click the Undo button in the header bar. This undoes the most recent change—keep clicking to undo multiple changes.
Redoing changes
Section titled “Redoing changes”To redo a change you’ve undone by mistake, click the Redo button in the header bar.
Frequently asked questions
Section titled “Frequently asked questions”Can multiple people edit the same dashboard at the same time?
Technically yes, but we don’t recommend it. Dashboard Publisher uses optimistic concurrency with version numbers—if someone else saves changes while you’re editing, your next save fails with a “Save Failed! Your dashboard is not up to date!” message showing who made the conflicting edit and when. You’ll be prompted to reload the latest version, which means your unsaved changes are lost.
The safest approach? Coordinate with your team so only one person edits a dashboard at a time.
Can I duplicate any element in the dashboard?
You can duplicate pages, components and filters. In the Navigation Menu, click the ⋮ icon next to the item and select Duplicate.
Roles and the built-in Timeframe and Period filters can’t be duplicated.
Why can’t I remove a page?
A dashboard must always have at least one page. If you try to remove the only page, you’ll see the message “Please add another page before deleting this one!”. Add a new page first, then remove the old one.
Why can’t other people see the dashboards I’ve hidden?
Hiding a dashboard only hides it from your own view. Other users who have access still see it in their Active Content tab. To find a dashboard you’ve hidden, click the Hidden Content tab, then select Unhide from the more menu (⋮).
How does autosave work?
Dashboard Publisher saves automatically every time you make a change. You’ll see a “Save Success” notification at the bottom of the screen after each save. If you try to make another change before the previous save completes, you might see a “Save Failed” notification—just wait a moment and try again, or reload the dashboard if prompted.
Why don’t I see all properties for a component?
The properties shown in the Properties Menu depend on the component type you’ve selected. For example, Chart Settings only appear for chart components, and Focus Words Settings only appear for Focus Words components. You’ll only see properties that are relevant to what you’re editing.
Can I change a component’s type without deleting it?
Yes. Use the Component Type property to switch between different visualization and content formats. This lets you change how your data is displayed without removing and re-adding the component.
How do I resolve “Save Failed! Your dashboard is not up to date!”?
This happens when someone else has edited and saved the dashboard since you last loaded it. The dialog shows the version details, including who made the change and when.
- Click Yes to reload — this loads the latest version of the dashboard with the other person’s changes included. Your unsaved changes since your last successful save are lost.
- Coordinate with your team — to avoid this in future, make sure only one person edits a dashboard at a time.