

Sentiment Charts
The Snapshot tab of the Text Auto Report includes sentiment chart sections that give you a quick read on how your respondents feel and which topics are driving the conversation.
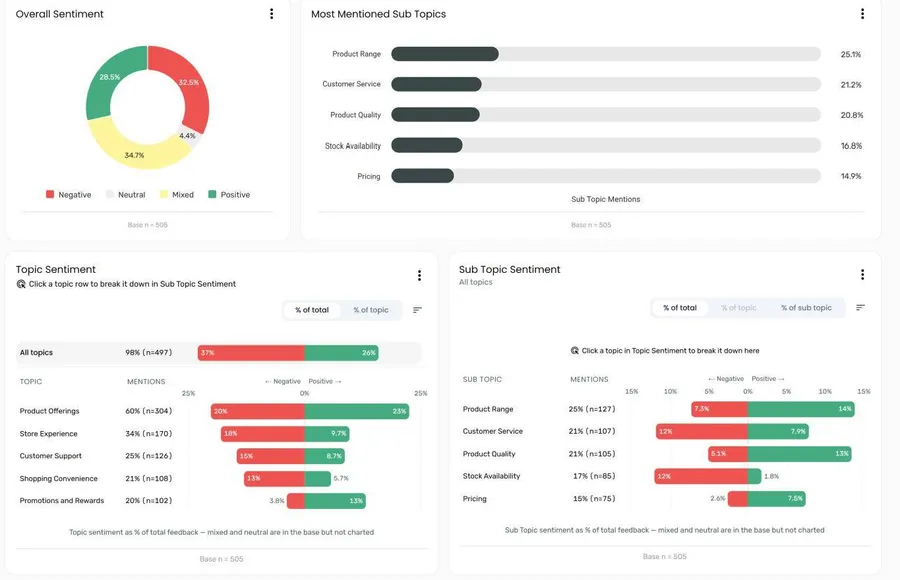
Overall Sentiment
Section titled “Overall Sentiment”The Overall Sentiment section displays a donut chart that breaks down all analysed responses by their assigned sentiment. Each segment represents one of four categories:
| Colour | Sentiment | What it means |
|---|---|---|
| Red | Negative | The response expresses a predominantly negative view |
| Light grey | Neutral | The response is neither positive nor negative |
| Yellow | Mixed | The response contains both positive and negative sentiment |
| Green | Positive | The response expresses a predominantly positive view |
Percentages are shown inside each segment. A sentiment with no responses isn’t shown in the chart or its legend. The base count (total responses analysed) appears beneath the chart.
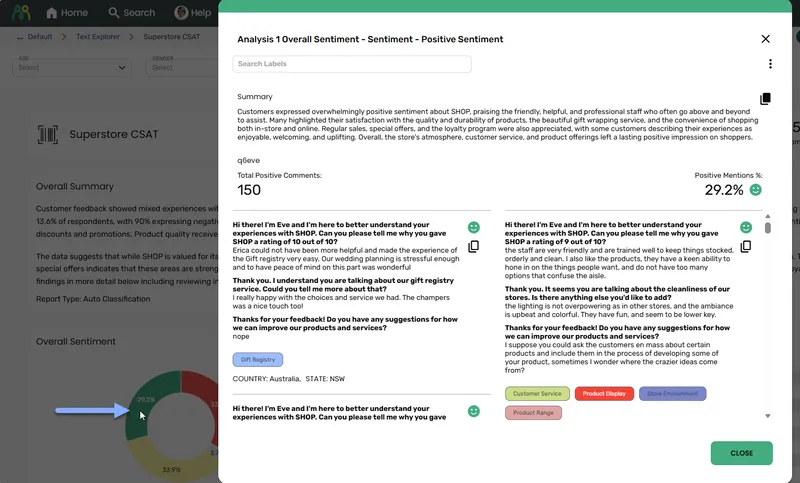
Click a segment to open the comment viewer with all comments of that sentiment. The viewer shows the total number of comments with that sentiment and lists up to 1,000 of them.
Most Mentioned Sub Topics
Section titled “Most Mentioned Sub Topics”This section shows the sub topics that appear most frequently across all responses, regardless of sentiment. Bars are displayed horizontally, with the percentage of total responses mentioning each sub topic shown on the right. The top five sub topics are shown by default.
The axis label reads Sub Topic Mentions — this reflects how often a sub topic was mentioned, not how positively or negatively it was discussed.
Click a bar to open the comment viewer for that sub topic.
| Menu option (⋮) | What it does |
|---|---|
| Hide Section | Removes the section from view. Use Manage Layout in the report settings to restore it. |
| Export as Excel | Downloads the underlying chart data as a spreadsheet |
| Export as PNG | Downloads the chart as a PNG image |
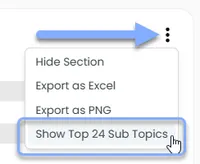
| Show Top 24 Sub Topics | Expands the chart to show up to 24 sub topics instead of the default 5. Select Show Top 5 Sub Topics from the same menu to return to the default view. |
Topic Sentiment and Sub Topic Sentiment
Section titled “Topic Sentiment and Sub Topic Sentiment”These two charts sit side by side and show positive and negative sentiment for each topic and sub topic. Negative bars extend to the left and positive bars to the right, with the number of mentions beside each name.
Breaking a topic down
Section titled “Breaking a topic down”Click any topic row in the Topic Sentiment chart to break it down in the Sub Topic Sentiment chart, which then shows only that topic’s sub topics, with the topic itself at the top. Click the selected topic again to go back to every sub topic.
Hover over a bar to see its percentage.
Reading the comments behind a bar
Section titled “Reading the comments behind a bar”Click a bar to open the comment viewer for those comments:
- All topics — the row at the top of the Topic Sentiment chart opens every comment that mentions any topic.
- A topic — once you’ve selected a topic, click its row at the top of the Sub Topic Sentiment chart to open that topic’s comments.
- A sub topic — click any sub topic row in the Sub Topic Sentiment chart to open that sub topic’s comments.
Each comment is counted once, even if it mentions several sub topics of the same topic. Export Comments in the viewer is only available for a sub topic’s comments, not for a whole topic or All topics.
Choosing what the percentages show
Section titled “Choosing what the percentages show”Use the toggle on each chart to choose what the percentages are based on:
| Option | What it shows |
|---|---|
| % of total | Sentiment as a percentage of all feedback |
| % of topic | Sentiment as a percentage of the topic’s own responses. On Sub Topic Sentiment, this is only available once you’ve selected a topic. |
| % of sub topic | Sub Topic Sentiment only. Sentiment as a percentage of each sub topic’s own responses. |
Mixed and neutral responses are included in the base but not charted, so bars don’t always fill the track.
Sorting
Section titled “Sorting”Use the sort button on each chart to order rows by Most mentioned (the default), Most positive, or Most negative. Sorting by Most positive or Most negative is the quickest way to see what respondents are happiest and unhappiest with.
Menu options
Section titled “Menu options”Each chart shows the top 5 rows by default.
| Menu option (⋮) | What it does |
|---|---|
| Hide Section | Removes the chart from view. Use Manage Layout in the report settings to restore it. |
| Export as PNG | Downloads the chart, with every row, as a PNG image |
| Show all / Show top 5 | Shows every topic or sub topic, or returns to the top 5 |
| Export Sentiment Splits | Downloads an Excel file with mentions and the positive, mixed, neutral, and negative percentages for every topic and sub topic |
When you export the report to PowerPoint, both charts appear on a Topic & Sub Topic Sentiment slide, based on % of total.
Original report design
Section titled “Original report design”In the original report design (with the New UI toggle off), Most Positive Sub Topics and Most Negative Sub Topics are shown instead of Topic Sentiment and Sub Topic Sentiment. They rank sub topics by the proportion of their mentions that are positive or negative. Click a bar to open the comment viewer for that sub topic, filtered to that sentiment.
Frequently asked questions
Section titled “Frequently asked questions”Why can’t I see the Topic Sentiment chart?
Topic Sentiment is only available for reports that use auto-classification. Reports using a model you specified yourself, or one reused from the library, show Sub Topic Sentiment only. It may also have been hidden — check Manage Layout.
Why does a sub topic rank highly on Most negative but not Most mentioned?
Most mentioned ranks by how often a sub topic comes up, while Most negative ranks by the share of feedback that’s negative about it. A sub topic mentioned rarely but almost always negatively can rank highly on Most negative without being one of the most mentioned.
Do the filter bar selections affect these charts?
Yes. All sentiment charts respond to the filter bar at the top of the report. Selecting a timeframe, period, or filter variable updates them all. If a filter removes the topic you’ve selected in Topic Sentiment, the Sub Topic Sentiment chart goes back to all topics.
Can I see the individual comments behind a sub topic?
Click a bar in Most Mentioned Sub Topics or Sub Topic Sentiment, or use the Sub Topic Deep Dive section to explore individual responses for a specific sub topic, with sentiment filtering. See Sub Topic Deep Dive. To search all comments, use Comment Search.
I can’t see this section in my report — where has it gone?
It may have been hidden. Open the settings menu in the report toolbar and select Manage Layout to see all available sections and toggle them back on.