

Set up a project
To get your Text Auto Report up and running, you connect a data source, choose what the report should include, pick the variables to analyse, and set up the pages of your report. The set-up wizard walks you through each step, shown in the progress bar across the top:
- Choose Data Source
- Pick Your Report Type
- Select Variables
- Define Your Measure — only when your report includes Time Series or Cause & Effect
- Configure Report Pages
Use next and back to move between steps. Once a step has been chosen, the selected data source is shown at the top of every step.
Step 1: Choose Data Source
Section titled “Step 1: Choose Data Source”The first step is choosing the data source that contains your text responses.
- Open Text Explorer from the Portal home page.
- Click Create at the top of the content table.
- Enter a Project Name and click Next.
- In the Choose Data Source step, browse or search for your data source.
- Click the data store you want to use, then click next.
Once you’ve added a page to your report, the data source can’t be changed.
Step 2: Pick Your Report Type
Section titled “Step 2: Pick Your Report Type”Choose the tabs you want available in your report. You’ll decide which pages actually use each one later, so nothing here is locked in — it just sets up the steps you’ll need along the way. Choose at least one.
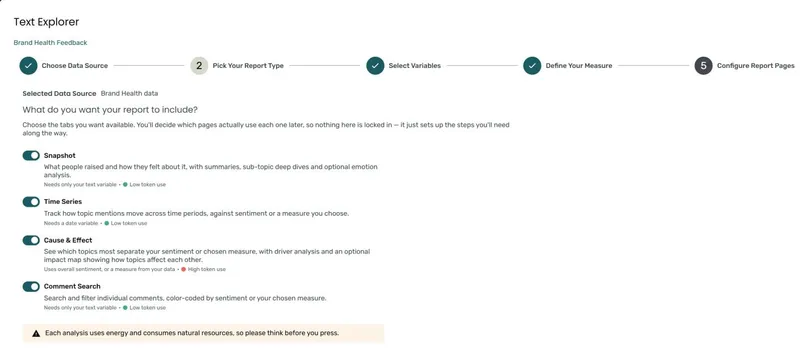
| Report type | What it gives you | Needs |
|---|---|---|
| Snapshot | What people raised and how they felt about it, with summaries, sub topic deep dives and optional emotion analysis | Only your text variable |
| Time Series | How topic mentions move across time periods, against sentiment or a measure you choose. See Time Series. | A date variable |
| Cause & Effect | Which topics most separate your sentiment or chosen measure, with driver analysis and an optional impact map showing how topics affect each other. See Cause & Effect. | Overall sentiment, or a measure from your data |
| Comment Search | Search and filter individual comments, colour-coded by sentiment or your chosen measure. See Comment Search. | Only your text variable |
Each option shows how much it uses — Low token use or, for Cause & Effect, High token use.
The first time you continue from this step on a new report, you’re asked to accept the AI Terms and Conditions if you haven’t already.
Step 3: Select Variables
Section titled “Step 3: Select Variables”Drag variables from the Available Variables list on the left into the relevant box. To remove a variable you’ve added, click the trash icon on its card.
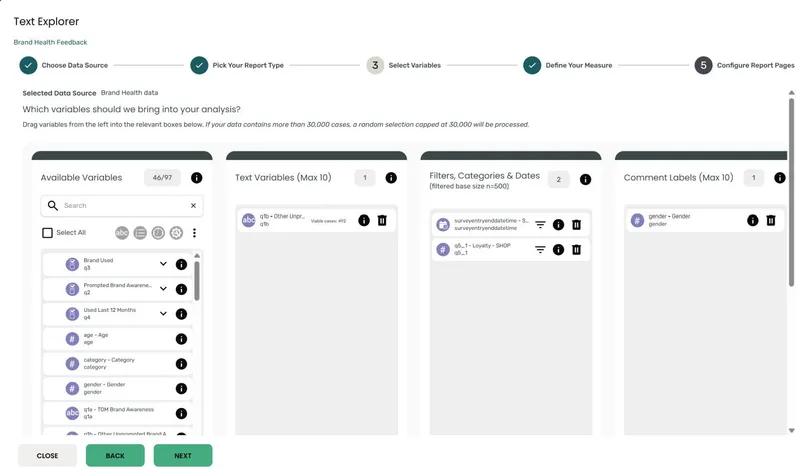
Text Variables (Max 10)
Section titled “Text Variables (Max 10)”Drag the open-ended response fields you want to analyse here — the verbatims, comments, and free-text answers. At least one is required, and you can add up to 10.
Each text variable card shows its Viable cases — the number of cases with text to analyse. If a text variable has a problem, a warning icon appears on its card — hover over it for details. For example, the variable may have a low base, more than half of cases may have no data, or it may have no text to analyse.
Filters, Categories & Dates
Section titled “Filters, Categories & Dates”Drag categorical, numeric, or date variables here to make them available as filters and comparison dimensions in your Text Auto Report and Workbench — for example, age group, region, satisfaction rating, NPS score, or survey date. If you plan to use Time Series, add your date variable here too. Non-date variables need a codeframe to be added here.
Each variable added to this box appears as a dropdown filter at the top of the Text Auto Report, letting users slice and compare results by segment.

The header of the Filters, Categories & Dates box shows a filtered base size that updates as you drag variables in and apply filters, so you can see how many records will be processed.
Filtering on a variable’s values
Each variable in this box has a filter icon. Click it to restrict the analysis to specific values of that variable:
- For categorical variables — select which code values to include
- For date/datetime variables — set a date range
Date Aggregation
When a date/datetime variable is added to this box, a Date Aggregation panel appears next to the boxes. Use it to choose how results can be grouped over time — these appear as filters in your report.
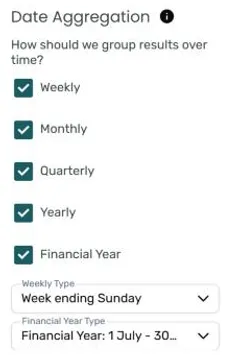
- All five groupings — Weekly, Monthly, Quarterly, Yearly, and Financial Year — are ticked by default. Untick any you don’t want.
- For Weekly, choose a Weekly Type, such as Week ending Sunday.
- For Financial Year, choose a Financial Year Type — Financial Year: 1 July - 30 June, 1 Oct - 30 Sept, 1 Apr - 31 March, or 1 Jan - 31 Dec.
You can’t continue until you’ve chosen the type for Weekly and Financial Year, or unticked them.
Comment Labels (Max 10)
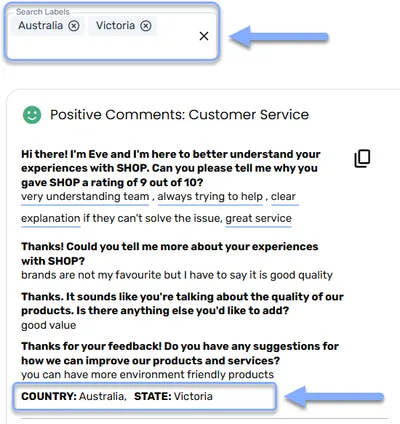
Section titled “Comment Labels (Max 10)”Drag variables here to display their values as contextual metadata alongside each comment — useful for adding context like respondent ID or date. Once configured, label values appear in:
- The comment viewer
- The Sub Topic Deep Dive section
- The Emotional Insights section
- Comment Search
Up to 10 label variables can be added.
Step 4: Define Your Measure
Section titled “Step 4: Define Your Measure”This step appears when your report includes Time Series or Cause & Effect. It’s where you choose the measure your report tracks over time, or explains.
What to Measure
Section titled “What to Measure”- Date Variable — select the date variable to use for tracking, for example the survey end date. The dropdown lists the date variables you added in Step 3; if there’s only one, it’s selected for you. This only appears when your report includes Time Series.
- Dependent Variable — choose the measure to track or explain:
- Overall Sentiment — scored from what people wrote. No further configuration needed; you’re done with this step.
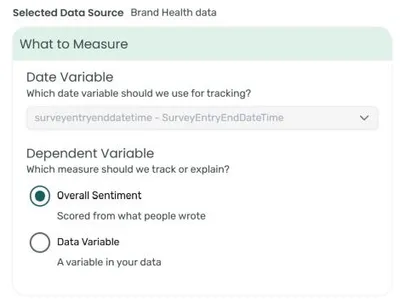
- Data Variable — a metric from your data, such as OSAT or NPS. This opens the Configure the Variable panel.
Tracking a data variable
Section titled “Tracking a data variable”If you chose Data Variable, configure how it’s measured:
- Select Variable — choose the variable, for example a satisfaction or likelihood-to-recommend rating. Numeric and coded variables are listed.
- Metric Label — set the name this metric will have in your report, such as “OSAT” or “NPS”. Required.
- Report As — choose how the variable is summarised. Mean is selected by default.
- Mean — report the average value per period. Best for ratings where the average is the number you track.
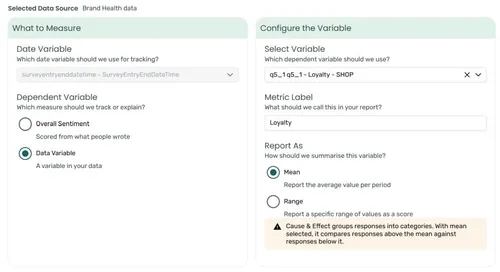
- Range — report the percentage of responses falling in a specific range of values as a score. Best for top-box style metrics like Promoters or % Satisfied.
- Mean — report the average value per period. Best for ratings where the average is the number you track.
Defining the groups
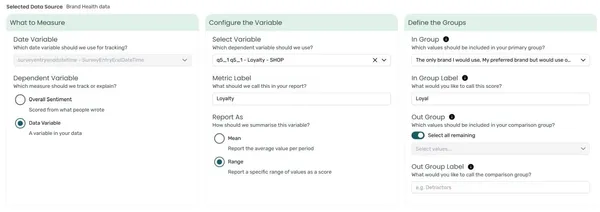
If you chose Range, a Define the Groups panel appears:
- In Group — the values that count towards your score, for example 9 and 10 for NPS promoters.
- In Group Label — name the score as it should appear in your report, for example “Promoters”.
- Out Group — the values to compare against. Turn on Select all remaining to include every other value, or pick specific values yourself. Values in neither group are left out of the base.
- Out Group Label — name the comparison group, for example “Detractors”. You only need this if Select all remaining is off; otherwise the comparison group is called “everyone else”.
If the variable has a codeframe, you pick the values from a list. If it’s a plain number, type the values instead — single numbers or ranges, separated by commas, for example 9, 10, 9-10, or 0-6, 8. The In Group and Out Group can’t share any values.
When the measure is locked
Section titled “When the measure is locked”Once a report page uses Time Series or Driver Analysis, this step shows a read-only summary of your measure, because every page is built against it.
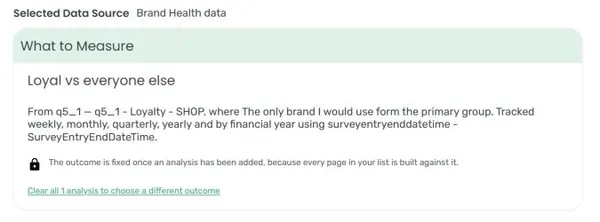
To choose a different measure, click Clear all N analyses to choose a different outcome.
Step 5: Configure Report Pages
Section titled “Step 5: Configure Report Pages”This is where you build the pages of your report. Each text variable you analyse becomes its own page, and each page appears as a filter at the top of your Text Auto Report.
The step has two parts: Page Settings, where you set up a page, and Report Pages, the list of pages you’ve added.
Page Settings
Section titled “Page Settings”Work through the three boxes, then click ADD.
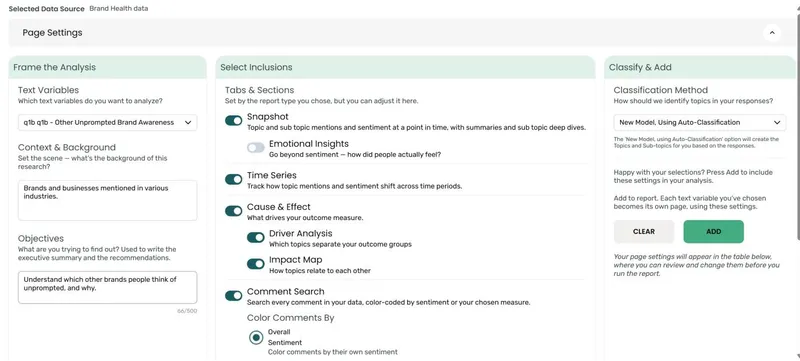
Frame the Analysis
| Field | What to enter |
|---|---|
| Copy settings from | Optional. Start from a page you’ve already set up — everything except the text variable and the model is copied. Only shown once you’ve added a page. |
| Text Variables | The text variable(s) to analyse. Each one becomes its own page. |
| Context & Background | A short description of the research — for example, “Feedback from customers about product quality for ACME.” It’s generated automatically from your variables; review it and edit if needed. The AI report writer uses this context to interpret your data. Required. |
| Objectives | Optional. What you’re trying to find out — for example, “Understand why unprompted awareness has fallen in the under-35 segment, and what would shift it.” Used to write the executive summary and the recommendations. Up to 500 characters. |
Select Inclusions
Choose which tabs and sections this page includes. They start from the report types you chose in Step 2, but you can adjust them here. Turning on a tab you didn’t choose in Step 2 adds it to the report.
| Option | What it adds |
|---|---|
| Snapshot | Topic and sub topic mentions and sentiment at a point in time, with summaries and sub topic deep dives |
| Emotional Insights | Shown under Snapshot. Goes beyond sentiment to explore how people actually felt. See Emotional Insights. Only one page per text variable can have Emotional Insights, and it can only be chosen when the page is built. |
| Time Series | How topic mentions and sentiment shift across time periods. Unavailable if no date variable was added in Step 3. |
| Cause & Effect | What drives your outcome measure, with two parts: Driver Analysis (which topics separate your outcome groups) and Impact Map (how topics relate to each other). Driver Analysis needs a complete measure in Step 4. |
| Comment Search | Search every comment in your data, colour-coded by sentiment or a rating from your data. See Colouring comments below. |
Classify & Add
Choose how topics and sub topics are identified in your responses:
| Option | What it does |
|---|---|
| New Model, Using Auto-Classification | AI automatically identifies and creates topics and sub topics from the text. Recommended for most users. |
| New Model, Specify yourself | You define your own topic structure before processing. Click Specify to build the model. |
| Re-use existing Model from library | Apply a previously built classification model. Click Search to select one. |
Click ADD to add the page to the bottom of your Report Pages list, or CLEAR to start again. Page Settings then folds away — click Add Page on the folded bar to set up another page.
Colouring comments
Section titled “Colouring comments”If you include Comment Search, choose how comments are coloured under Color Comments By:
- Overall Sentiment — each comment is coloured by its own sentiment.
- Data Variable — each comment is coloured by a rating from your data, such as NPS. Choose the Rating Variable, then choose which values count as Positive Values, Neutral Values, and Negative Values. Turn on Select all remaining under Negative Values to include every value not already used.
If you pick the same rating you used in Step 4, the groups start from your In Group and Out Group. For a plain number, type the values as numbers or ranges, for example 9-10. A value can only be in one group, and any value you don’t assign is left out of Comment Search.
Report Pages
Section titled “Report Pages”Each page you add appears here, in the order it will appear in the report.
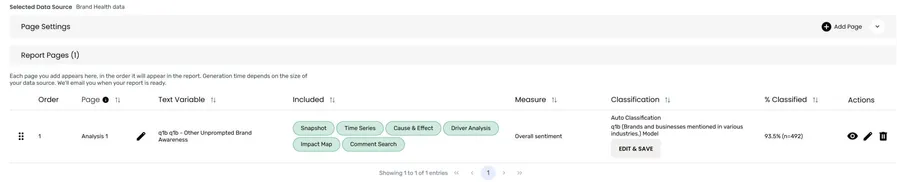
| Column | What it shows |
|---|---|
| Order | The page’s position in the report. Drag rows to reorder them. |
| Page | The page name. New pages are named Analysis 1, Analysis 2, and so on — click the pencil next to the name to rename it. Page names must be unique. |
| Text Variable | The text variable the page analyses |
| Included | The tabs and sections included on the page |
| Measure | The measure, on pages that use Time Series or Driver Analysis |
| Classification | The classification method. Click EDIT & SAVE to inspect or modify the topics and sub topics. |
| % Classified | The proportion of text classified into topics |
The model is built and coverage is checked automatically after you click ADD. While this is in progress, Generating Model… or Checking Coverage… shows in the Classification column.
Use the icons on each row to:
- View (eye) — open Page Details to read the page’s settings. Click EDIT THIS PAGE to change them.
- Edit (pencil) — open Edit Report Options to change which tabs and sections the page includes. Emotional Insights can’t be turned on here — it’s chosen when a page is built, so to add it, build a new page for that text variable.
- Delete (trash) — remove the page.
Running the report
Section titled “Running the report”Once your pages are ready, click Done. The project is submitted for processing. The status changes to Processing, then Success when complete — your Text Auto Report is ready, and we’ll email you when it is.
Processing time varies depending on the volume of text and the number of pages. For large data sets this can take several minutes.
Changing the report later
Section titled “Changing the report later”To add variables, pages, or tabs to an existing report, use Edit Report from within the Text Auto Report — see Editing report settings. To update the project with fresh data, see Updating data.
Variable types
Section titled “Variable types”The Available Variables list in the Select Variables step has a search bar and type filter icons at the top. Click a type icon to show only that variable type in the list.
 | Text — open-ended free-text fields |
 | Codeframe — categorical variables with coded values |
 | Date/time — date and datetime fields |
 | System — system-generated metadata fields |
Frequently asked questions
Section titled “Frequently asked questions”I can’t find the data store I want to use — where is it?
The Show Surveys Only toggle above the data store list is on by default. This filters out any data store that isn’t a survey. Turn the toggle off to see all available data stores.
Which report types should I choose?
Start with Snapshot for a written summary of what people said and how they felt. Add Time Series if you’re tracking results over time and have a date variable, Cause & Effect if you want to know what drives sentiment or a measure such as NPS, and Comment Search if you want to browse individual comments. Cause & Effect uses the most tokens, so only include it where you need it.
Can I add more variables or pages after the report has run?
Yes — use Edit Report from within the Text Auto Report. See Editing report settings. The data source can’t be changed.
How many text variables can I include in one project?
Up to 10. Each additional text variable increases processing time, so focus on the variables most relevant to your analysis goals.
Can I use the same data store in multiple projects?
Yes. Multiple Text Explorer projects can use the same data store simultaneously. Each project maintains its own variable selection and page configuration independently.
My project failed during processing — what now?
Check that your selected text variables actually contain text data. If the variable is mostly empty or contains numeric data, processing will fail. Open the project to see the error details, then correct your variable selections.
Why don’t I see the Define Your Measure step?
The step only appears when your report includes Time Series or Cause & Effect. Go back to Pick Your Report Type and turn one of them on.
Should I measure Overall Sentiment or a Data Variable?
Choose Overall Sentiment when the question is “is the tone of our feedback improving, and what’s driving it?” — it follows the sentiment of the text itself. Choose a Data Variable when you have a scored metric like OSAT or NPS in your data and want the text analysis anchored to how that number moves, or to what separates high and low scorers.
What’s the difference between Mean and Range?
Mean reports the average value per time period — the natural choice for a rating scale where you track the average. Range reports the percentage of responses falling within values you define, as a named score — the right choice for top-box metrics like Promoters (9–10 on NPS) or % Satisfied. For Cause & Effect, Range compares your In Group with your Out Group, and Mean compares responses above the mean with those below it.
Why can’t I turn on Driver Analysis?
Driver Analysis compares two groups, so it needs a complete measure in Define Your Measure. A data variable reported as a mean needs the variable chosen, and one reported as a range needs both an In Group and an Out Group.
Why can’t I turn on Emotional Insights for a page?
Emotional Insights is chosen when a page is built, so it’s greyed out in Edit Report Options — to add it, build a new page for that text variable. Only one page per text variable can include it, so if another page for the same text variable already has it, it can’t be added again. It’s also shown only while Snapshot is on for the page.
The Done button is greyed out — why can’t I proceed?
The Done button stays disabled until at least one page has been added to Report Pages and its model has finished building. After you click ADD, Text Explorer builds the classification model and checks coverage automatically — this can take a moment. Wait for Generating Model… or Checking Coverage… to clear in the Classification column.