

Opportunity Score
You can’t fix everything at once. The Opportunity Score tells you where to start: it ranks every sub category by how much there is to gain from improving it, and shows the result as a star rating from half a star to five stars.
What goes into the score
Section titled “What goes into the score”An issue is a big opportunity when lots of customers mention it, they rate it poorly, and it really affects how they rate you overall. The score weighs up all of these:
| Factor | The question it answers |
|---|---|
| Rating gap | How far below the top of the rating scale is this issue’s average rating? |
| Reach | How many customers mention it? |
| Importance | How strongly does it drive customers’ ratings? Action Connect works this out from your data. |
For segment rows (see Breakdowns by segment), two more factors come in: how big the segment is, and how the segment rates the issue compared to everyone else. A segment that rates an issue worse than everyone else scores higher, because it’s being underserved.
The scores are then compared with each other and spread across the star range, so the stars always show how issues rank against each other in this project. Hover over the info icon in the Opportunity Score column header for the full formula.
Reading the table
Section titled “Reading the table”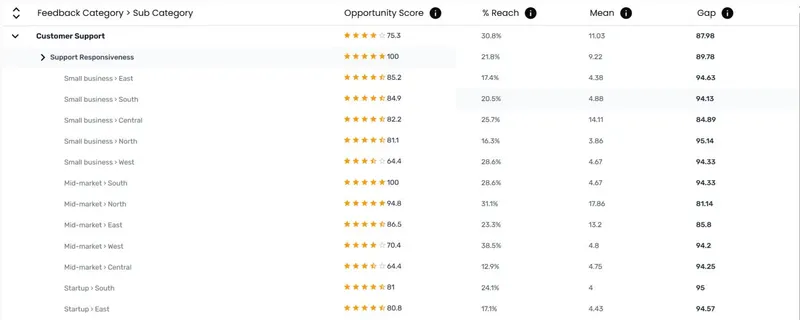
Topics are listed with the biggest opportunity first. Expand a topic to see its sub categories, also sorted highest first.
| Column | What it shows |
|---|---|
| Feedback Category > Sub Category | The topic, sub category or segment. |
| Opportunity Score | Stars from half a star to five, plus the score as a number out of 100. |
| % Reach | The share of feedback that mentions this topic. |
| Mean | The average rating, on your project’s own rating scale. |
| Gap | How far the mean sits below the top of the rating scale. A bigger gap means more room to improve. |
Every column header has an info icon. Hover over it for a quick explanation.
A topic’s score combines the scores of its sub categories, giving more weight to the sub categories that more customers mention.
Breakdowns by segment
Section titled “Breakdowns by segment”If you chose Priority Analysis Filters when you set up the project, each sub category expands to show a row for every value of those variables. For example, with “Region” chosen, you’ll see the sub category’s score in each region. Choose two variables, such as “Region” and “Customer Type”, and you’ll see every combination.
Segment rows are scored against other segment rows, so the stars show which segments have the most to gain. Use them to find the places where an issue hits hardest.
Very large breakdowns are trimmed: each variable shows at most its 24 most common values, and at most 60 segments are shown in total.
To add segments, the Priority Analysis Filters have to be chosen when the project is created. See Step 4: Priority Analysis Filters.
How filters affect the score
Section titled “How filters affect the score”The Opportunity Score always compares against all of your feedback, so filtering doesn’t change the scores:
- Topic and Subtopic hide the rows you’re not interested in.
- In Other filters …, choosing values of a Priority Analysis Filter variable narrows its segment rows to those values.
- The other filters, such as Period, Owner ID, Initiative and search, don’t affect this tab.
This keeps the scores stable and comparable, however you slice the view.
Using the score
Section titled “Using the score”- Start at the top - The first few topics and sub categories are your biggest opportunities.
- Check the reasons - Look at % Reach, Mean and Gap to see why something scores highly: is it common, poorly rated, or both?
- Find where it hurts most - Expand a sub category to see which segments score highest.
- Read the feedback - Filter the Customer Feedback tab by that Topic and Subtopic to hear what customers are actually saying.
- Plan the fix - Create an initiative linked to the sub category, and track its Opportunity Index.
Export downloads a CSV with the full calculation for every row, showing each factor and step that went into the score. It reflects your current filters, so clear them first if you want everything.
Frequently asked questions
Section titled “Frequently asked questions”Why doesn’t my project have an Opportunity Score tab?
It needs ratings. If your project was set up without My Actions have ratings, you’ll need a new project with ratings to get the Opportunity Score.
Why does an issue with lots of mentions have a low score?
Volume is only one factor. If customers who mention it still rate you highly, or it doesn’t affect their overall rating much, there’s less to gain from fixing it.
Why didn’t the scores change when I filtered?
That’s by design. The scores always compare against all your feedback, so the numbers stay comparable. The topic filters hide rows, and filtering on a Priority Analysis Filter variable narrows its segment rows. Other filters don’t affect this tab.
What rating scale does it use?
Your project’s own. Action Connect works out the scale from your rating data, so it works with 0-10, 1-7, ±100 and other scales. To leave out values like “Don’t know”, use Define Valid Rating Values when you set up the project.
How does this relate to the Initiatives tab?
An initiative’s Opportunity Index combines the Opportunity Scores of the sub categories it’s linked to. A linked sub category shows the same number on both tabs.