

Publishing a dashboard
A dashboard must be published in order for it to be shared with others. You can publish at any time, and as frequently as you want. If you make a change to a dashboard, you must republish in order for the changes to be updated in the live dashboard.
Once published, the live dashboard appears in the HumanListening Portal content table with the content type Dashboard, where it can be opened and shared. The version you edit in Dashboard Publisher is listed as a Dashboard Project.
Publishing a dashboard
Section titled “Publishing a dashboard”To publish a dashboard:
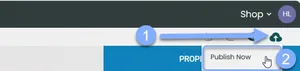
- Click the Publish button in the header bar.
- Select Publish Now from the dropdown menu.
- If Dashboard Publisher finds any problems with the dashboard, the Dashboard Errors Found! dialog lists them and asks whether you’d like to publish anyway. Click NO to go back and fix them, or YES to publish regardless. For what each message means, see the frequently asked questions at the bottom of this page.
- In the Publish Success dialog, click Yes to view the published dashboard (it opens in a new tab).
If someone else has saved changes to the dashboard since you loaded it, you’ll see “Publish Failed! Your dashboard is not up to date!” with details of who made the latest change and when. Click Yes to reload the latest version, then publish again.
Previewing a dashboard
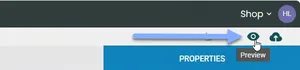
Section titled “Previewing a dashboard”To preview a dashboard, click the Preview button in the header bar. The preview opens in a new tab and shows your latest saved changes with live data, so you can check your edits before you publish them.
The publish menu
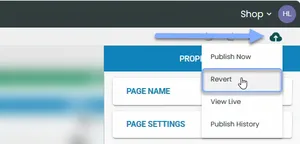
Section titled “The publish menu”The Publish dropdown always includes Publish Now. Once the dashboard has been published, it also includes Revert, View Live and Publish History.
Reverting to a previously published version
Section titled “Reverting to a previously published version”If you need to disregard the changes made to a dashboard since it was last published:
- Click the Publish button in the header bar.
- Select Revert from the dropdown menu.
- In the Revert Dashboard confirmation dialog, click Yes to reload the last published version of the dashboard.
Unpublishing a dashboard
Section titled “Unpublishing a dashboard”To unpublish a dashboard so viewers can no longer open it:
- In Dashboard Publisher, hover over the dashboard in the content table and click the more icon (⋮).
- Select Unpublish from the menu.
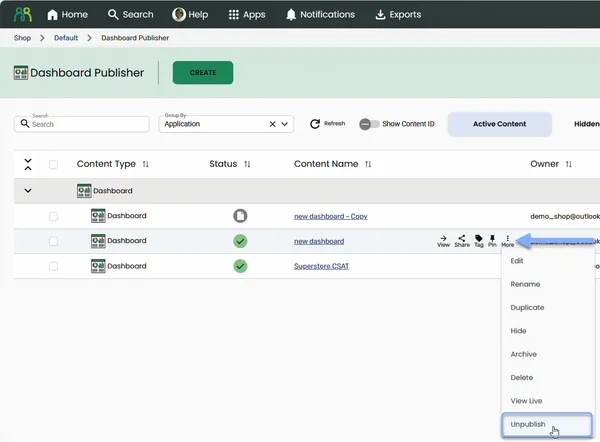
There’s no confirmation step. The dashboard’s status changes from Published to Draft, and viewers can no longer open it until it’s published again.
Viewing a live dashboard
Section titled “Viewing a live dashboard”There are several ways to view a live dashboard:
Via HumanListening Portal:
- In the Portal content table, click the dashboard name. Live dashboards are listed with the content type Dashboard.
Within the Dashboard Publisher editor:
- Click the Publish button in the header bar.
- Select View Live from the dropdown menu. The live dashboard opens in a new tab.
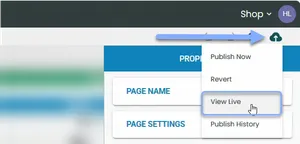
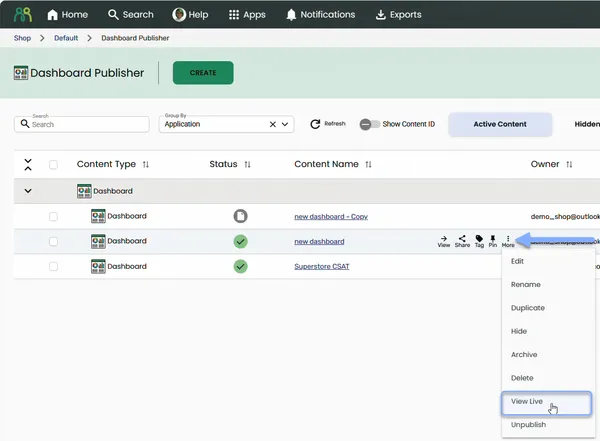
From the Dashboard Publisher content table:
- Hover over the dashboard in the content table and click the more icon (⋮).
- Select View Live from the menu. This option only appears for published dashboards.
- If you’ve been given more than one role for the dashboard, the Select Dashboard Role dialog opens. Choose the role you want to view the dashboard as, then click OK.
The live dashboard opens in the same tab.
You can also choose to view the dashboard when you publish it, from the Publish Success dialog.
Viewing who last published a dashboard
Section titled “Viewing who last published a dashboard”To view a dashboard’s publish history:
- Click the Publish button in the header bar.
- Select Publish History from the dropdown menu.
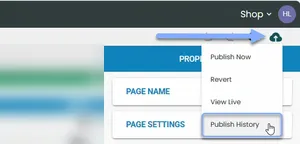
- The Version History dialog opens. Its title shows the current version number, and the table lists each publish with its Version, Publish Date/Time and Published By (the publisher’s email address).
Changing a connected data exploration
Section titled “Changing a connected data exploration”If you change a connected exploration in Data Explorer, check the live dashboard to make sure the change shows as expected. If it doesn’t, republish the dashboard.
If you delete an exploration in Data Explorer, any connected components show an error in the dashboard, and you’ll see an Unable To Find Data Exploration alert when you open the dashboard in the editor. Reconnect or remove the affected components, then republish to clear the error.
Frequently asked questions
Section titled “Frequently asked questions”What do the dashboard errors mean?
When you click Publish Now, Dashboard Publisher checks your entire dashboard configuration. If any issues are found, the Dashboard Errors Found! dialog lists them and asks “Would you like to publish anyway?”. These are warnings, not blockers: you can click YES to publish, but the issues may produce unexpected results. Here are the messages you may see and how to fix them:
Page errors:
- “Page is missing Label Text” — The page has no URL. Open the page properties and enter a URL.
- “Page: URL must be unique” — Two or more pages have the same URL. Edit the URL property on the duplicate pages to make each one unique.
- “Page has an invalid Title” — The page Title doesn’t contain any letters (for example, it’s empty or only numbers). Edit the Title property so it includes at least one letter.
Component errors:
- “Page Items: Page Item ID must be unique” — Two components share the same ID. This is an advanced setting; contact your administrator or support team for help.
Filter errors:
- “Filter does not have a registered Key Field” — The filter hasn’t been fully configured. Open the filter settings and set the Key Field.
- “Filter: Key Field must be unique” — Two filters use the same key field. Remove or reconfigure one of them.
- “Filter is missing a Column Name for the underlying data store” — The filter needs a data store column. Open the filter settings and select the appropriate column.
- “Filter is marked as being a Manual Filter, but was not provided with a query” — The filter is set up as a manual filter but has no query. This is an advanced setting; contact your administrator for help.
- “Filter is marked as being Bindable, but is not bound to any page items across any page” — You’ve created a bindable filter but haven’t connected it to any components. Either bind the filter to at least one component, or turn off Is Bindable in the filter’s Binding section.
- “Filter contains key(s) as both Parent & Child filters” — A filter can’t reference the same key field in both its parent and child filter configuration. Review the nested filter setup and remove the conflicting key.
Low base blocking errors (for pages with Enable Low Base Blocking turned on):
- “Low Base Blocking check is enabled but Minimum Base Size is not set to a valid positive number” — Enter a number greater than 0 in Minimum Base Size.
- “Low Base Blocking check is enabled but no data source has been configured” — Open the page’s DATA SOURCE tab and connect a base size data source.
- “Low Base Blocking data source is missing a Data Exploration” or “…has no cell selected” — Open the page’s data source, select the exploration and click the cell that holds the base size.
- “Low Base Blocking query data source query must include a “value” column” (or “…is missing a query”) — The base size query needs fixing. This is an advanced setting; contact your administrator for help.
For more about low base blocking, see Dashboard pages.
How do I fix a 404 error when previewing a dashboard?
If you see a 404 error when clicking Preview:
- Check the first page has a URL — the preview opens the first page in your dashboard, so make sure its URL field isn’t empty.
- Check for duplicate page URLs — open each page’s properties and make sure every URL field is unique across the dashboard.
- Check for special characters — avoid special characters in page URLs. Remove any and try again.