

Text Auto Report
The Text Auto Report is an automatically generated dashboard built from your Text Explorer project’s analysis results. It presents sentiment, themes, and topic insights in a structured, ready-to-share format — no chart-building required. The report updates automatically whenever the linked project reruns.
Accessing the Text Auto Report
Section titled “Accessing the Text Auto Report”- Open Text Explorer from the Portal home page.
- In the Text Explorer content table, hover over your project row and click View.
The report opens immediately for projects with a Success status. If the project is still in Draft, clicking View opens the setup wizard instead.
Report toolbar
Section titled “Report toolbar”
The toolbar at the top of the report gives you quick access to key actions without returning to the Text Explorer home page:
- Pre-processing Status (tick icon) — shows the status of the project’s last run
- New UI — switch between the current report design and the original one
- Edit Report — change the report’s tabs, variables, or pages. See Editing report settings
- Explore in Workbench (chart icon) — open the project in the Workbench
- Append Data — update the report with fresh data. See Updating data
- Export to Powerpoint — export the report as a PowerPoint presentation
- Report Settings (⋮) — access Manage Schedule, Manage Layout, Audit Log, and Comment Labels
Report header
Section titled “Report header”
At the top of the report, the header shows key project information at a glance:
- Project name and logo
- Last Updated — when the project last ran
- Text Quality Score (TQS) and Human Insights Factor (HIF) — two scores describing the text behind the current page. See Quality and insight scores below.
- Comments — total number of text responses analysed
- Topics — number of top-level topics identified. Click to see the full topic list.
- Sub Topics — number of sub topics. Click to browse and jump directly to a sub topic in the report.
- Ask EVE — open a chat interface to ask questions about the report. See Ask EVE.
Quality and insight scores
Section titled “Quality and insight scores”
The header displays two scores that describe the text data behind your report, each on a 0–100 scale:
| Score | What it measures |
|---|---|
| Text Quality Score (TQS) | The quality of the text data being analysed — shown with a gauge |
| Human Insights Factor (HIF) | The depth and richness of insight in the responses |
Each score is a weighted combination of several sub-metrics. Click the info icon next to a score to see how it’s calculated, including the sub-metric breakdown that rolls up into the number.
Both scores describe the text variable behind the current page. They change when you switch pages with the Analysis Title filter, but not when you apply other filters.
Filter bar
Section titled “Filter bar”
The filter bar sits at the top of the report, above the header, and stays in view as you scroll. It lets you slice all report sections simultaneously without changing the underlying project. It’s only shown when your project has more than one page, a date variable, or filter variables to choose from.
| Control | What it does |
|---|---|
| Analysis Title | Switch between the pages of your report. Only shown when the report has more than one page. |
| Timeframe | Filter by a predefined time window |
| Period | Set the specific date range within the timeframe |
| Filter variables | Additional dropdowns for any supporting variables added during project setup |
Click Apply to update the report with your selections. Click Clear to remove all active filters and return to the unfiltered view.
Filters apply across every section in the report at once.
Report tabs
Section titled “Report tabs”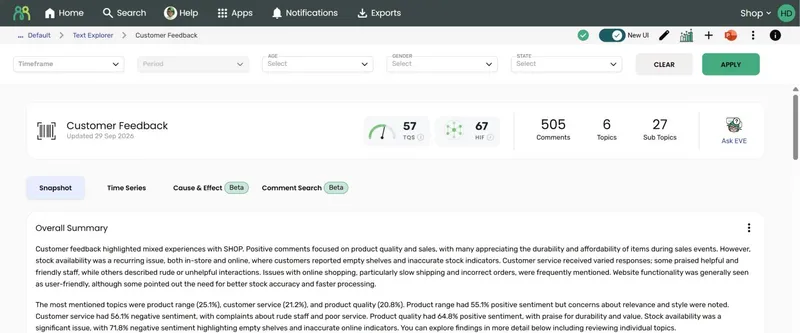
The report is organised into tabs, shown below the header. Which tabs appear depends on what was included for the page during project setup:
| Tab | What it contains |
|---|---|
| Snapshot | The report sections listed below — sentiment, topics, deep dives, and more |
| Time Series | How topics, sentiment, and your tracked metric change over time. See Time Series. |
| Cause & Effect (Beta) | The sub topics that drive your outcome measure, and the Impact Map. See Cause & Effect. |
| Comment Search (Beta) | Search and read every comment behind the report. See Comment Search. |
If a page has only one tab, the tab row isn’t shown — the report displays that tab’s content directly. When you switch pages using the Analysis Title filter, the report opens on the first tab that page has.
Report sections
Section titled “Report sections”The Snapshot tab is divided into sections, each covering a different aspect of the analysis. Sections can be expanded, collapsed, or hidden using the menu icon (⋮) on each section card.
| Section | What it shows |
|---|---|
| Overall Summary | An AI-generated narrative summary of the key findings across the whole dataset |
| Overall Sentiment | A donut chart showing the proportion of positive, negative, neutral, and mixed sentiment |
| Most Mentioned Sub Topics | A bar chart of the most frequently discussed sub topics |
| Topic Sentiment | Positive and negative sentiment for each topic. Click a topic to break it down in Sub Topic Sentiment. Auto-classification reports only. See Sentiment Charts. |
| Sub Topic Sentiment | Positive and negative sentiment for each sub topic |
| Sentiment vs Occurrence | A scatter chart plotting each sub topic by how often it’s mentioned and how positive or negative it is |
| Sub Topic Deep Dive | Detailed statistics and individual comments for a selected sub topic, with sentiment filtering |
| Emotional Insights | A Plutchik emotion wheel and emotion-level deep dive. See Emotional Insights. Only appears when an emotional analysis variable is configured. |
| Comparison Charts | Results broken out by a comparison variable for side-by-side analysis |
| Appendix | Model structure, topic and sub topic tree, and analysis metadata |
The number of comments, topics and sub topics is shown in the report header. The Impact Map is now on the Cause & Effect tab.
Managing the report layout
Section titled “Managing the report layout”Select Manage Layout from the More options menu in the report toolbar to control which sections appear in your report and to upload a project logo.
Show and hide sections
Section titled “Show and hide sections”Each report section has a toggle. Switch a section off to hide it from the report view on every page. To restore a hidden section, open Manage Layout and turn the toggle back on.
The Impact Map toggle controls the Impact Map on the Cause & Effect tab. If Impact Maps were turned off for every page when the report was set up, the toggle is locked, because there’s no impact map to show.
Manage Layout doesn’t control the content of the Time Series, Cause & Effect or Comment Search tabs.
Use the Export Hidden Sections toggle to include hidden sections when exporting the report to PowerPoint. This setting doesn’t apply to the Impact Map section.
Upload a logo to display at the top of the report — for example, a client or project brand mark. Supported formats: JPG, PNG, BMP, JPEG, SVG. Maximum file size: 10 MB.
Audit Log
Section titled “Audit Log”Select Audit Log from the More options menu in the report toolbar to see a history of changes to the report. Each change is listed with:
| Column | What it shows |
|---|---|
| Last Updated Date | When the change was made |
| User | Who made the change |
| Changes | A summary of what changed |
The newest changes are listed first. Click the User or Changes column heading to sort by that column.
Comment viewer
Section titled “Comment viewer”Click a data point in a chart section to open the comment viewer for that selection. This works across most sections — overall sentiment, most mentioned sub topics, the Topic Sentiment and Sub Topic Sentiment charts, occurrence, the impact map, and more. It doesn’t apply to the Emotional Insights petal chart.
To search all comments for a page, rather than the comments behind one data point, use Comment Search.
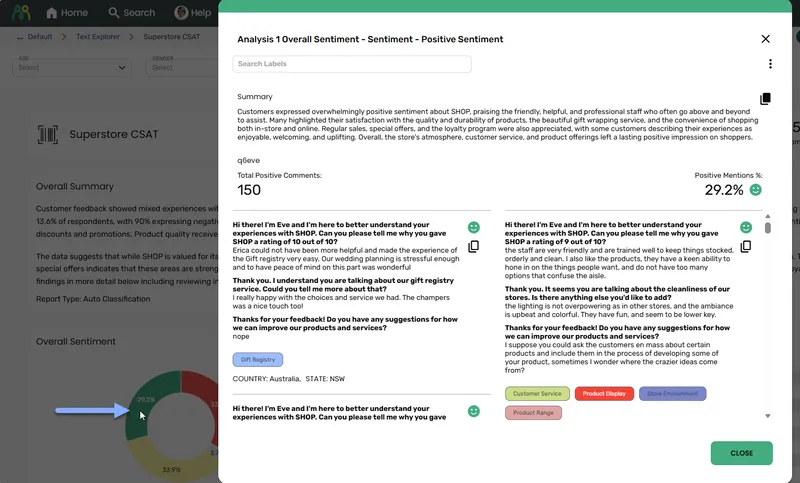
At the top of the comment viewer, an AI-generated Summary gives a narrative overview of the selected responses. A copy button next to the summary lets you copy the full text to your clipboard.
Below the summary, individual comments are listed. Each comment has its own copy button to copy that response to your clipboard. If Comment Labels have been configured for the project, the label values for each respondent appear beneath their comment.
A Search Labels bar at the top of the viewer lets you filter the comment list by label values — useful when you want to focus on a specific segment within the selection.
Display options and export
Section titled “Display options and export”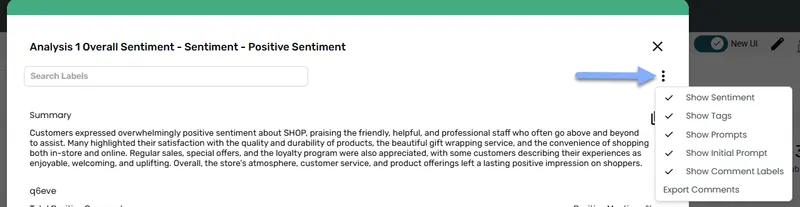
The ⋮ menu in the top-right corner of the viewer gives you additional controls:
| Option | What it does |
|---|---|
| Show Sentiment | Toggle sentiment indicators on or off for each comment |
| Show Tags | Toggle topic and sub topic tags on or off |
| Show Prompts | Toggle the survey prompt associated with each response |
| Show Initial Prompt | Toggle the initial survey prompt |
| Show Comment Labels | Toggle label values on or off beneath each comment |
| Export Comments | Export the full list of comments in the current view |
Sharing the report
Section titled “Sharing the report”The Text Auto Report can be shared with colleagues who only need to view results. See Share and export for instructions.
Editing report settings
Section titled “Editing report settings”Project owners and editors can change an existing Text Auto Report without starting over. Click the Edit (pencil) icon in the report toolbar. Edit Report opens in the same wizard used to set up a project, starting at Pick Your Report Type, with your existing settings filled in.
What you can change:
- The report types — add or remove Snapshot, Time Series, Cause & Effect, or Comment Search
- Text, filter, and comment label variables, and date aggregation settings
- Your measure, until a page uses Time Series or Driver Analysis
- Report pages — add, rename, reorder, copy, or delete them
- What each page includes — click the Edit (pencil) icon on a page to open Edit Report Options and turn Snapshot, Emotional Insights, Time Series, Cause & Effect, or Comment Search on or off
What you cannot change:
- The data source (this step isn’t shown when editing)
- Emotional Insights on an existing page — it’s chosen when a page is built, so to add it, build a new page for that text variable
Click Run to save your changes and re-run the report. The report status returns to Processing while this runs, then updates to Success with the new results. If you close the wizard without running, any pages you added are removed.
Frequently asked questions
Section titled “Frequently asked questions”Why don’t the TQS and HIF scores change when I apply filters?
By design. The Text Quality Score and Human Insights Factor describe the full text variable behind the current page, not the currently filtered view. This keeps the metrics stable and avoids reading too much into small filtered samples. They do change when you switch to a different page with Analysis Title, because each page analyses a different text variable.
Why doesn’t my report have a particular tab?
Each tab is included page by page during project setup. Time Series also needs a date variable, and Cause & Effect needs a measure. Use Edit Report to add a tab. If a page has only one tab, no tab row is shown.
Where has the Impact Map gone?
It’s moved to the Cause & Effect tab. Older reports with an Impact Map now have a Cause & Effect tab showing it.
Where have Most Positive and Most Negative Sub Topics gone?
They’ve been replaced by the Topic Sentiment and Sub Topic Sentiment charts, which show positive and negative sentiment side by side and can be sorted by either. See Sentiment Charts.
Does the report update automatically when the project reruns?
Yes. When the linked project completes a run — either manually triggered or on a schedule — the Text Auto Report refreshes with the updated results. See Updating data for how to set up recurring runs.
Can I export sections from the report?
Yes. Each section has a menu (⋮) with export options. You can export stats or copy an AI-generated summary for individual sections. The Topic Sentiment and Sub Topic Sentiment charts have Export Sentiment Splits, and Comment Search has Download Comments. For bulk chart exports, use the Workbench output library.
The Emotional Insights section isn’t showing — why?
Emotional Insights only appears on pages where it was included during project setup. It’s chosen when a page is built and is shown on the Snapshot tab, so it can’t be added to an existing page later — use Edit Report to build a new page for that text variable with Emotional Insights turned on.
Can I change what sections appear in the report?
Report sections are generated automatically. Sections that don’t have relevant data (such as Emotional Insights without an emotions variable) are hidden automatically. You can hide or show individual sections using Manage Layout in the settings menu. To add tabs, pages, or variables to an existing report, use Edit Report.
A section has disappeared from my report — how do I get it back?
It may have been hidden. Open the settings menu in the report toolbar and select Manage Layout to see all available sections and toggle them back on.