

Emotional Insights
The Emotional Insights section of the Text Auto Report goes beyond positive and negative sentiment to show the specific emotions expressed in your text responses. It uses the Plutchik model — a framework of eight primary emotions — to categorise the emotional tone of feedback and help you understand not just whether customers feel good or bad, but how they feel.
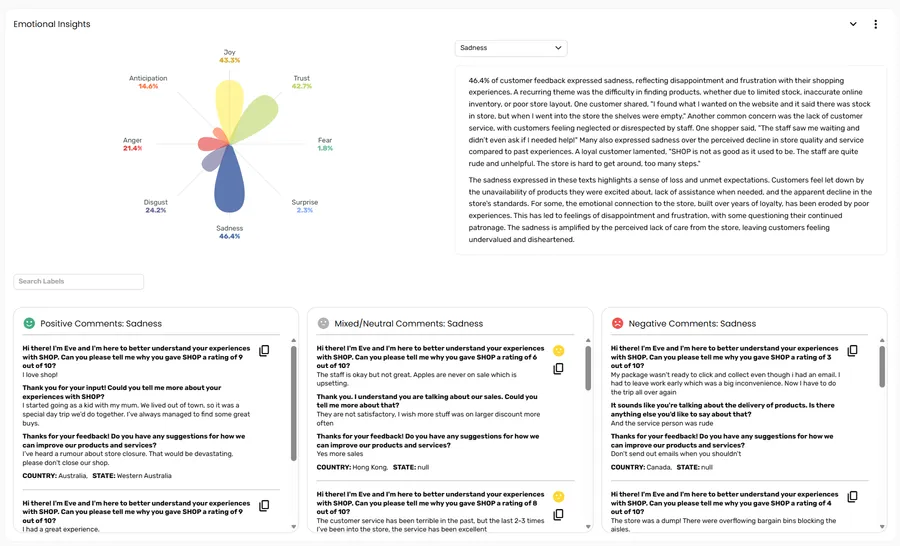
The emotion wheel
Section titled “The emotion wheel”The centrepiece of the Emotional Insights section is a polar wheel chart with eight petals, one for each of the Plutchik primary emotions:
| Emotion | Typical expression in feedback |
|---|---|
| Joy | Positive experiences, delight, satisfaction |
| Trust | Confidence, reliability, loyalty |
| Fear | Concern, anxiety, worry about risk |
| Surprise | Unexpected experiences, both positive and negative |
| Sadness | Disappointment, loss, regret |
| Disgust | Strong dissatisfaction, rejection |
| Anger | Frustration, resentment |
| Anticipation | Expectation, hope, forward-looking sentiment |
Each petal’s size reflects the proportion of responses expressing that emotion. The percentage is displayed alongside each petal label.
Selecting an emotion
Section titled “Selecting an emotion”Use the dropdown to the right of the petal chart to select an emotion and load the deep-dive view.
Emotion deep dive
Section titled “Emotion deep dive”When you select an emotion, the section below the wheel updates to show individual comments for that emotion. The percentage breakdown of emotions is shown directly on the petal chart.
- Filtered comments — Individual responses classified under that emotion, grouped by sentiment (positive, negative, neutral, mixed)
- Comment filtering — Use the filter chips to narrow comments by label or keyword within the selected emotion
Navigate between emotions using the dropdown to the right of the petal chart.
Section controls
Section titled “Section controls”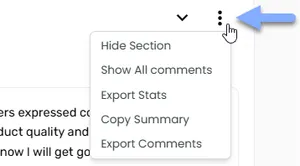
Use the ⋮ menu in the top-right corner of the section card to access these options:
| Option | What it does |
|---|---|
| Hide Section | Removes the section from view. Use Manage Layout in the report settings to restore it. |
| Show All Comments | Opens all comments across every sentiment group for the selected emotion |
| Export Stats | Downloads the frequency and sentiment statistics for the selected emotion |
| Copy Summary | Copies the AI-generated summary text to your clipboard |
| Export Comments | Downloads the comments for the selected emotion |
Frequently asked questions
Section titled “Frequently asked questions”How are emotions assigned to responses?
Emotions are assigned by the emotional analysis model configured for your project. The model analyses the language in each response and assigns a primary emotion based on the words and phrases used. A response can only be classified under one primary emotion.
What’s the difference between Emotional Insights and the Sentiment sections?
The Sentiment sections (Overall Sentiment, Topic Sentiment, and Sub Topic Sentiment) classify responses on a positive-to-negative scale. Emotional Insights goes further — it identifies the specific emotion type, so you can distinguish between, say, customers who are angry versus customers who are merely sad, or those who are joyful versus those who express anticipation. Both views are complementary.
Why do some emotions have very low percentages?
Not all emotions appear equally in every dataset. Depending on the nature of your feedback — for example, post-purchase reviews versus complaints — certain emotions will naturally dominate. Low percentages for an emotion simply mean it is less commonly expressed in your specific dataset, not that the model is unable to detect it.
I can’t see this section in my report — where has it gone?
It may have been hidden. Open the settings menu in the report toolbar and select Manage Layout to see all available sections and toggle them back on.