

Monitor completes
Real-time survey statistics can be viewed via the Survey Statistics page in Survey Shaper. It’s your survey’s dashboard: how many people have started and completed the survey, how long they took, where people drop out, and how your quotas are filling.
Open Survey Statistics
Section titled “Open Survey Statistics”You can open the Survey Statistics page from Portal home, from Survey Shaper, or while you’re editing the survey.
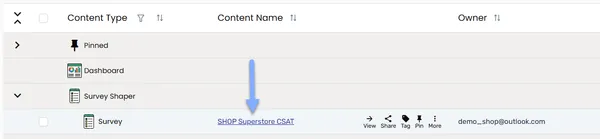
From Portal home (survey name): click the survey name in the Portal home content table.
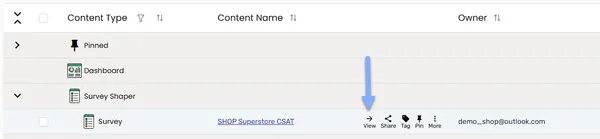
From Portal home (view icon): hover over the survey in the Portal home content table and click the View icon.
From Survey Shaper: click the more icon (⋮) on the survey, then select Monitor Responses > Survey Statistics.
While editing the survey:
Click Survey Stats in the main menu.

Click the Survey Stats icon in the header.
The page has four tabs: Daily Statistics, Hourly Statistics, Survey Ticker and Sample Management. It opens on Daily Statistics.
To go back to editing the survey, click Edit Script in the header. It opens the survey in the editor you’re using.
Daily statistics
Section titled “Daily statistics”At the top of the Daily Statistics tab, you’ll see the following key metrics:
- Invitations Sent: the number of survey invitations that were sent using the built-in mailer. This information is not available for surveys distributed externally.
- Surveys Started: the number of surveys started
- Surveys Completed: the number of completed surveys. Underneath is the completion rate, as a percentage: completes divided by starts.
- Median Duration: the median time taken to complete the survey, in minutes
These numbers update on their own every few seconds while the page is open.
Choose a date range
Section titled “Choose a date range”The chart below the metrics shows the number of Survey Completions each day. It opens showing the last 3 months.
To change the period, either:
- Click a Zoom button above the chart: 1m, 3m, 6m, YTD, 1y or All
- Drag the handles on the small timeline under the chart
- Click the calendar in Enter a date range, choose a start and end date, and click Apply. For a single day, click the date twice.
The metrics and the statistics tabs below the chart update to match the period you choose.
Statistics tabs
Section titled “Statistics tabs”Below the chart, more statistics are grouped in tabs. Each tab shows figures for the period you’ve chosen (labelled Today, a date, or a date range) and a Cumulative total. Until you choose a period, they show the last 7 days.
| Tab | What it shows |
|---|---|
| Mail Statistics | Email Sent, Email Delivered, Email Bounced and Email Opened, for invitations sent by email from HumanListening. Empty if the survey doesn’t send email invitations. |
| Invitation Statistics | Invitation Created, Invitation Sent and Invitation Received |
| Mobile Statistics | % Mobile Device (starts) and % Mobile Device (completes): how many starts and completes were on a mobile device, and the percentage |
| Quota Statistics | Each quota’s Quota Name, Quota Current and Quota Limit. This tab always shows the current totals, whatever period you choose. See Manage quotas. |
| Top Incompletes | The questions where respondents stopped without finishing, with how many stopped at each. “Landing page” means they left before the first question. |
All the tabs except Quota Statistics are only available if your sub account uses the new control panel.
Hourly statistics
Section titled “Hourly statistics”Click the Hourly Statistics tab to see how many surveys were completed in each hour. The table has a row for each Report Hour and a column for each of the last 9 days, including today, with a Total row at the top.
The table shows a fixed 9 days: the date range on the Daily Statistics tab doesn’t change it. It doesn’t update on its own, so reload the page to see the latest numbers.
Survey ticker
Section titled “Survey ticker”The survey ticker shows a real-time count of every completed survey (“We’ve listened to … Respondents”). It’s designed to be shown on a screen, for example in an office or at an event. The count updates every few seconds.
- Click the Survey Ticker tab
- To show the ticker on its own, click Full Screen
To leave full screen, use your browser’s back button.
The Survey Statistics page doesn’t have its own export. To download responses, see Analyze results.