

Impact Map
The Impact Map goes beyond describing what sub topics appear in your data to understanding the why — the cause and effect relationships between them. It is built using a Bayesian network, a probabilistic model that identifies which sub topics are meaningfully connected, the direction of those relationships, and how strong each connection is.
Use the Impact Map to identify opportunities to improve customer experience, build brand equity, and uncover new product opportunities.
The Impact Map is on the Cause & Effect tab of the report, below the Drivers card. It’s included when Impact Map is turned on for the page during project setup. Click the arrow on the card to hide or show it.
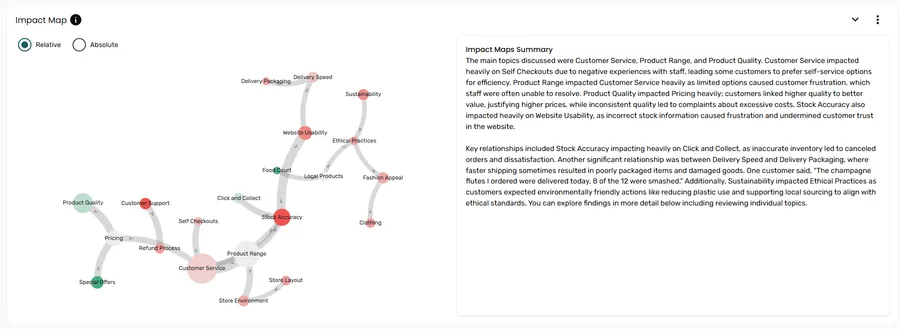
Reading the map
Section titled “Reading the map”Circles
Section titled “Circles”Each circle represents a sub topic. Two properties of the circle convey data at a glance:
| Property | What it shows |
|---|---|
| Size | The percentage of responses that mention this sub topic — larger circles are more frequently discussed |
| Colour | The sentiment for this sub topic — green indicates positive feedback overall, red indicates negative feedback overall |
Colour can be displayed in two modes, controlled by a toggle on the section:
- Relative (default) — colour tones are shifted to accentuate differences between sub topics, making it easier to compare sentiment across the map
- Absolute — colours reflect the absolute sentiment score for each sub topic
The grey lines connecting circles show the relationships between sub topics, based on how often they co-occur in the same individual responses.
| Line property | What it shows |
|---|---|
| Arrow direction | The direction of causality — the arrow points from the influencing sub topic to the one it influences |
| Thickness | The strength of the relationship — thicker lines indicate a stronger association |
Not all sub topics appear in the network. Only statistically significant relationships are shown.
Interacting with the map
Section titled “Interacting with the map”Hover over a circle to see a summary of that sub topic.
Hover over a line to see a brief explanation of how the two connected sub topics are related.
Click a circle to open the comment viewer filtered to that sub topic.
Impact Maps Summary
Section titled “Impact Maps Summary”To the right of the Impact Map, the Impact Maps Summary panel provides an AI-generated narrative of the key findings, including the most important relationships to be aware of. This is useful for sharing context with stakeholders who may not want to explore the interactive map themselves.
How it connects to Drivers
Section titled “How it connects to Drivers”When a sub topic is selected in the Drivers card, the How it connects to other subtopics section uses the Impact Map to show which sub topics influence it and which it influences.
Exporting
Section titled “Exporting”When you export the report to PowerPoint, the Impact Map is included as long as it isn’t hidden in Manage Layout. The export includes:
- An animated version of the Impact Map
- A table summarising all relationships shown in the map
Frequently asked questions
Section titled “Frequently asked questions”Why are some sub topics not connected to others?
Only statistically significant relationships are shown. Sub topics that are discussed independently — without meaningfully co-occurring with other sub topics in individual responses — will appear as isolated circles with no connecting lines.
What does the arrow direction mean?
The arrow points from the influencing sub topic to the one it influences — showing the direction of causality, not just association. For example, an arrow from “Wait Time” to “Staff Attitude” would suggest that mentions of wait time tend to co-occur with and influence how respondents discuss staff attitude.
What’s the difference between Relative and Absolute colour modes?
Both use green for positive and red for negative, but Relative mode shifts the colour tones to emphasise differences between sub topics — useful when sentiment scores are similar across the map and you want to bring out contrasts. Absolute mode shows the absolute sentiment score for each sub topic without adjustment.
Where has the Impact Map gone?
It’s moved from the Snapshot tab to the Cause & Effect tab. Older reports that have an Impact Map now have a Cause & Effect tab showing it.
The Impact Map isn’t showing in my report — why?
There are a few possible reasons:
- Impact Map wasn’t turned on for the page. The card says Impact Maps were turned off when the report was set up. Use Edit Report to turn it on.
- It’s been hidden. Open the settings menu in the report toolbar, select Manage Layout, and turn the Impact Map toggle back on.
- There isn’t enough data. The Impact Map needs enough data to find meaningful relationships. If your project has a small dataset or very few sub topics, there may be nothing to show.