

Feedback Categories tab
The Feedback Categories tab steps back from individual records to show the big picture: all your feedback, grouped by category and sub category. Use it to spot the most common issues, see how each one rates, and dig into the feedback behind them.
Understanding the table
Section titled “Understanding the table”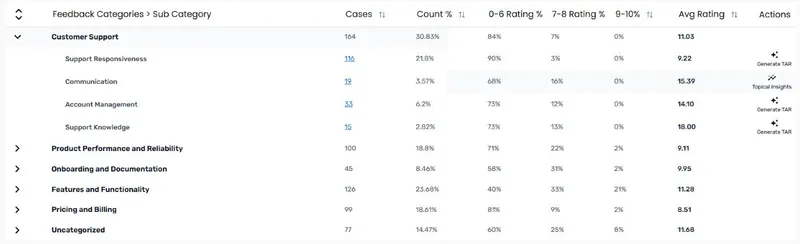
Each category row expands to show its sub categories.
| Column | What it shows |
|---|---|
| Feedback Categories > Sub Category | The category or sub category name. |
| Cases | How many pieces of feedback are in this group. Hover over it to see how many cases were processed in total. |
| Count % | This group’s share of all categorized feedback. |
| 0-6 Rating % | Share of this group’s feedback rated 0 to 6. Only shown if the project has ratings. |
| 7-8 Rating % | Share rated 7 or 8. Only shown if the project has ratings. |
| 9-10% | Share rated 9 or 10. Only shown if the project has ratings. |
| Avg Rating | The group’s average rating. Only shown if the project has ratings. |
The table follows your filters, so you can, for example, see the categories for one owner or one period.
Seeing the feedback behind a number
Section titled “Seeing the feedback behind a number”On a sub-category row, click the Cases number. A dialog opens listing every piece of feedback in that sub category, with its initiative and response text. It’s read-only. To review a record, find it on the Customer Feedback tab instead, for example by choosing the same Topic and Subtopic filters.
Using the table to prioritize
Section titled “Using the table to prioritize”- Open Feedback Categories - Click the tab in the project header.
- Expand the categories - See their sub categories and case counts.
- Look for high counts - These are your most common issues, and need a consistent response.
- Check the ratings - A high share of 0-6 ratings suggests customers are unhappy with how that issue is handled.
- Read the feedback - Click the Cases number on a sub category to read what customers are actually saying.
If your project has ratings, the Opportunity Score tab does this weighing up for you, combining volume, ratings and impact into one score.
Export downloads the table as a CSV file, with your filters applied.
Editing feedback categories
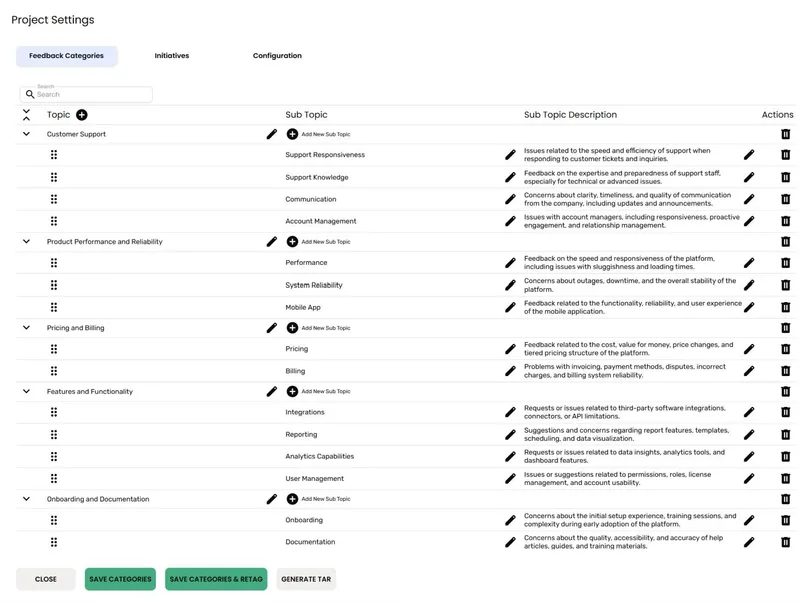
Section titled “Editing feedback categories”Click Settings in the project header to manage your categories. The Project Settings dialog opens on the Feedback Categories tab. If you’re a Project Lead or Viewer, the button reads View Settings, the tab is View Feedback Categories, and the list is read-only.
The tab lists your Topics (categories), each with its Sub Topics (sub categories). Sub topics can have a description, which helps the AI understand what belongs there. You can add, rename, reorder and delete topics and sub topics.
When you’re done, choose how to save:
Save Categories saves the category list only. Existing feedback keeps its current categories.
Save Categories & Retag saves the list and asks the AI to reclassify your feedback against it. The feedback shows as “Pending” for a few minutes while this runs in the background. Anything your team has already approved or changed is kept.
If you switch to another tab in Project Settings before saving, you’ll be asked whether to discard your changes. Click Stay on this tab to go back and save them.
Text Auto Reports
Section titled “Text Auto Reports”Want to dig deeper into what customers are saying? Action Connect can create a Text Auto Report (TAR) in Text Explorer from your project’s feedback, using your feedback categories as its topics.
For the whole project
Section titled “For the whole project”- Open the editor - Click Settings in the project header. The dialog opens on the Feedback Categories tab.
- Save first - If you’ve made changes, save them. You can’t generate a report with unsaved changes.
- Generate - Click Generate TAR. The Text Explorer report wizard opens with the project’s feedback and categories filled in. Finish the wizard to create the report.
Once it’s created, a View TAR button appears in the project header.
Generating again creates a brand new report and points View TAR at it. The old report stays in Text Explorer.
For one sub category
Section titled “For one sub category”On the Feedback Categories tab, hover over a sub-category row and click Generate TAR. The report covers only the feedback in that sub category, and finds its own, more detailed topics within it.
Once it’s created, the row’s action changes to Topical Insights, which opens the report.
Frequently asked questions
Section titled “Frequently asked questions”What’s the difference between Save Categories and Save Categories & Retag?
Save Categories updates the category list but leaves your feedback’s categories as they are. Save Categories & Retag also asks the AI to reclassify your feedback against the new list. Use Save Categories while you’re still building the list, and Save Categories & Retag when you’re ready to apply it.
Will retagging overwrite feedback I’ve already reviewed?
No. Anything your team has approved or changed is kept.
Why don’t the percentages add up to 100%?
Feedback with more than one classification counts in each of its categories.
Where did Defined Solutions go?
They’re now called initiatives, and one initiative can be linked to several sub categories. See Initiatives.
Why can’t I see Generate TAR?
Only the project owner can generate reports, and they need a Text Explorer license. The button also won’t work until the project has finished setting up.