

Explore data
By default, explorations display in a Data Table format. You can customize your view, change display options, and export your results.
Display options
Section titled “Display options”Access additional display and export options through the ellipsis menus on your exploration:
- Format Options - Customize how your data is displayed
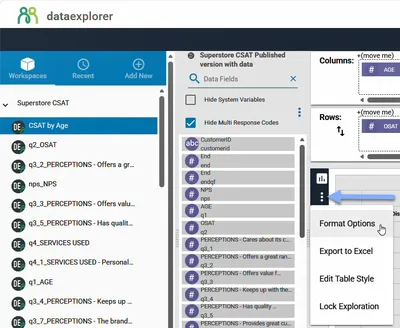
- Export - Download your exploration as Excel (for data tables) or PNG (for charts)
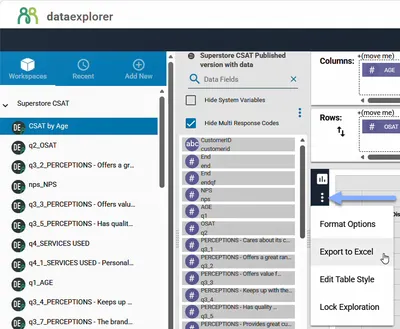
Chart types
Section titled “Chart types”Switch between table and chart views using the Chart Type menu. Available chart types include:
- Column chart
- Line chart
- Pie chart
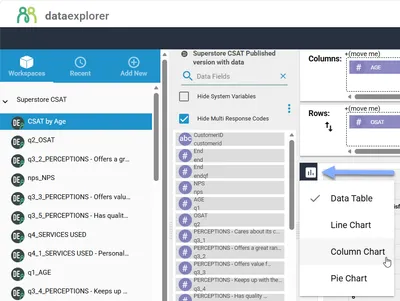
Chart format options
Section titled “Chart format options”When displaying your exploration as a chart, these format options are available:
| Option | Description |
|---|---|
| Show Values | Display data values on the chart |
| Show Legend | Display the chart legend |
| Stack Series | Stack data series (column charts only) |
Table format options
Section titled “Table format options”When displaying your exploration as a data table, these format options are available:
| Option | Description |
|---|---|
| Count | Shows the number of responses (cell frequency). Enabled by default. |
| Column % | Displays cell frequency as a proportion of the column total. Enabled by default. |
| Row % | Shows cell frequency as a proportion of the row total |
| Total % | Displays total percentage for crosstabs |
| Mean | Shows mean values for each column |
| Base | Shows total respondent count per column (visible when Column % is enabled) |
| Stat Testing | Reveals statistically significant differences using t-tests and z-tests |
| Hide Empty Categories | Removes columns or rows that have no responses |
| Column Total | Shows total responses for each column |
| Row Total | Shows total responses for each row |
| Column n | Displays the response count at the bottom of each column |
| Row n | Displays the response count at the right of each row |
| Subtotal | For multi-variable crosstabs, shows subgroup response totals |
| Decimal Places | Set the precision for displayed values (adjustable via the Format tab) |
| Suppress Nulls | Hide cells with no data instead of showing zeros |
Table styling
Section titled “Table styling”Customize the visual appearance of your data tables using style presets or custom settings. Click the Edit Table Style button in the toolbar to access the styling dialog.
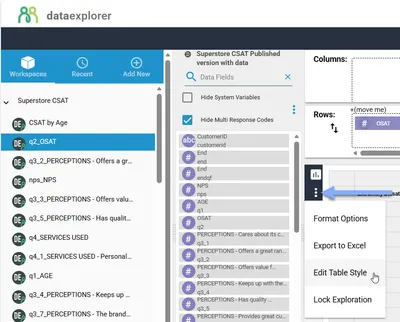
The Edit Table Style dialog is divided into four main sections, plus a live preview panel.
Table format
Section titled “Table format”Configure the appearance of your table headers and cells. Use the tabs to switch between Column Head, Row Head, and Table settings.
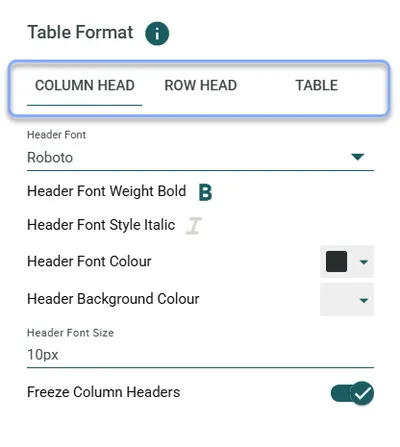
Column Head and Row Head tabs:
| Setting | Description |
|---|---|
| Header Font | Choose the font family for headers |
| Header Font Weight Bold | Toggle bold text |
| Header Font Style Italic | Toggle italic text |
| Header Font Colour | Set the text color |
| Header Background Colour | Set the background color |
| Header Font Size | Set the font size in pixels |
| Freeze Column Headers | Keep headers visible when scrolling (sticky headers) |
Table tab:
| Setting | Description |
|---|---|
| Cell Font | Choose the font family for table body cells |
| Cell Font Weight Bold | Toggle bold text for cell content |
| Cell Font Style Italic | Toggle italic text for cell content |
| Cell Font Colour | Set the text color for cell content |
| Table Font Size | Set the font size for table cells in pixels |
| Cell Background Colour | Set the background color for table cells |
Total and column N styles
Section titled “Total and column N styles”Configure the appearance of totals and column n rows separately from the main table. Use the tabs to switch between Row Totals and Column N settings.
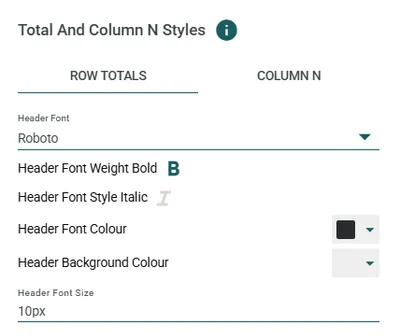
| Setting | Description |
|---|---|
| Header Font | Choose the font family |
| Header Font Weight Bold | Toggle bold text |
| Header Font Style Italic | Toggle italic text |
| Header Font Colour | Set the text color |
| Header Background Colour | Set the background color |
| Header Font Size | Set the font size in pixels |
Table appearance
Section titled “Table appearance”Control the overall look of your table rows and columns. Use the tabs to switch between Rows and Columns settings.
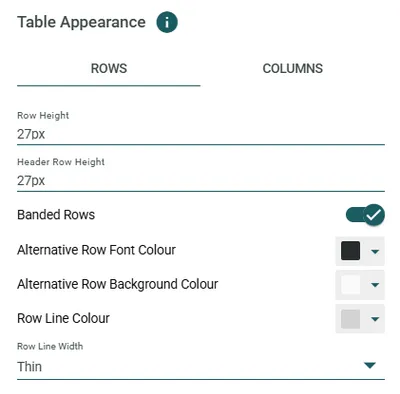
Rows tab:
| Setting | Description |
|---|---|
| Row Height | Set the height of data rows in pixels |
| Header Row Height | Set the height of header rows in pixels |
| Banded Rows | Toggle alternating row colors for easier reading |
| Alternative Row Font Colour | Set the text color for alternating rows |
| Alternative Row Background Colour | Set the background color for alternating rows |
| Row Line Colour | Set the color of row borders |
| Row Line Width | Set the thickness of row borders (Thin, Medium, Thick) |
Columns tab:
| Setting | Description |
|---|---|
| Column Line Colour | Set the color of column borders |
| Column Line Width | Set the thickness of column borders (Thin, Medium, Thick) |
Table settings
Section titled “Table settings”Configure additional table options and manage style presets.
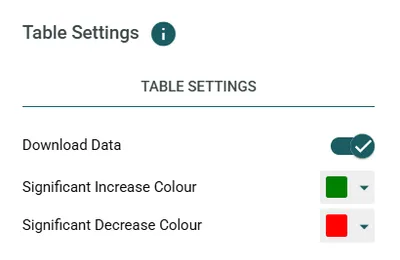
| Setting | Description |
|---|---|
| Download Data | Enable or disable the ability to download exploration data |
| Significant Increase Colour | Set the highlight color for statistically significant increases (default: green) |
| Significant Decrease Colour | Set the highlight color for statistically significant decreases (default: red) |
Table preview
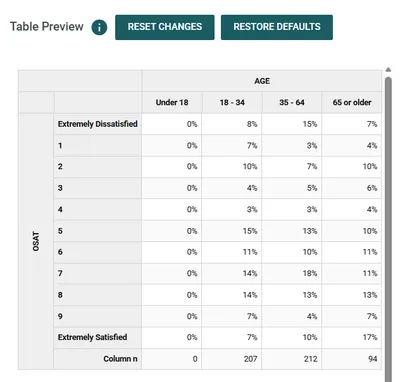
Section titled “Table preview”The preview panel on the right shows a live preview of your style changes. Use the Reset Changes button to undo unsaved changes, or Restore Defaults to return to the default styling.
Style presets
Section titled “Style presets”Save your styling choices as presets to quickly apply consistent formatting across multiple explorations.
- Configure your desired table style settings
- Click the + button next to Table Style Presets
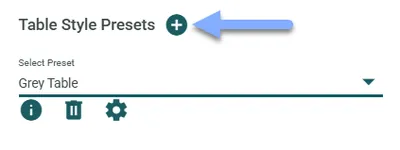
- Enter a name for your preset
- Click Save
To apply an existing preset, select it from the Select Preset dropdown menu.
Editing labels
Section titled “Editing labels”To modify answer labels in your exploration:
- Click on the label you want to change to select it
- Right-click on the selected label
- Select Rename from the context menu
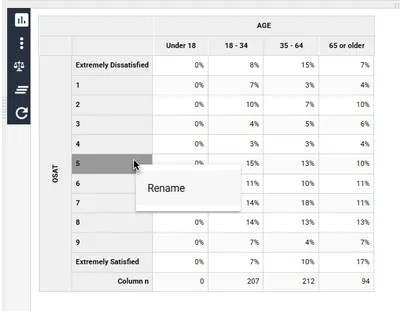
- Enter the new label text
- Click OK to confirm your changes
Date aggregation
Section titled “Date aggregation”For variables containing date or time data, you can aggregate values into different time periods. The Date Aggregation dialog opens automatically when you drag a date variable into your exploration.
Time periods available:
- Hours
- Days
- Weeks
- Months
- Quarters
- Years
Financial years: Choose from different fiscal year start dates:
- April 1 (UK/India)
- July 1 (Australia)
- October 1 (US Federal)
Date formats: Select between YY or YYYY format for displaying years.
To edit an existing date aggregation, click the ellipsis menu next to the date variable and select Date Aggregation to reopen the settings.
Rolling periods
Section titled “Rolling periods”Rolling Periods create a moving date range that combines results across multiple time periods. This is useful for smoothing out short-term fluctuations and identifying trends over time.
For example, a 3-month rolling period would show each month’s data combined with the previous two months, creating overlapping ranges that move forward through your data.
- Drag a date variable into your exploration (the Date Aggregation dialog opens automatically) or select Date Aggregation from the date variable’s ellipsis menu
- Select your base time period (e.g., Month if you want 3-month rolling periods)
- Choose your label format and apply any date filters as needed
- Check the Rolling Periods checkbox
- Enter the number of periods to combine (e.g., enter 3 to combine the current period with the previous 2)
- Select your labeling preference:
- End Points - Shows the full date range in the label (e.g., “Jan 2024 - Mar 2024”)
- Last Point - Shows only the final period in the range (e.g., “Mar 2024”)
- Click Save
Merging data
Section titled “Merging data”Merging combines multiple categories into a single item. This is useful for grouping related answer options together.
- Hold Shift and click to select multiple row or column headers
- Right-click on the selection
- Select Merge from the context menu
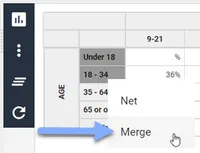
- Enter a label for the merged category
- Click OK to confirm
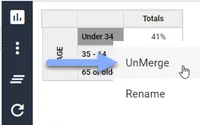
To separate merged items, right-click on the merged category and choose UnMerge from the context menu.
Netting data
Section titled “Netting data”Netting creates an additional row or column that shows the sum of selected categories while keeping the original items visible. This is useful for showing subtotals.
- Hold Shift and click to select multiple row or column headers
- Right-click on the selection
- Select Net from the context menu
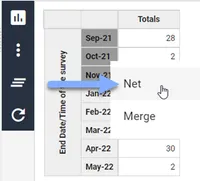
- Enter a label for the net category
- Click OK to confirm
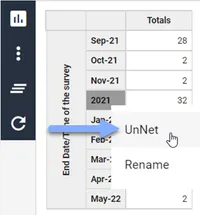
To remove a net, right-click on the netted category and choose UnNet from the context menu.
Locking explorations
Section titled “Locking explorations”Workspace owners can lock explorations to prevent accidental modifications. Locked explorations will continue to receive data updates but cannot be moved or edited.
To lock an exploration:
- Open the exploration in Edit mode
- Click the ellipsis menu in the floating toolbar
- Select Lock Exploration
Applying weights
Section titled “Applying weights”Weighting adjusts your analysis to account for sampling differences, allowing your data to better represent the target population.
Prerequisites
Section titled “Prerequisites”Your data store must contain variables with a _weighted suffix for Data Explorer to recognize them as weight factors. If your data store does not already contain a weighting variable, weight factors can be derived inside HumanListening using a Weighting step in a Data Wrangler wrangle.
Applying a weight
Section titled “Applying a weight”- Create a workspace and exploration using a data store that contains weight variables
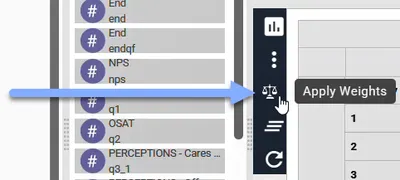
- Click the Apply Weights icon in the toolbar
- Toggle weighting to the On position
- Drag your desired weight variable from Available Fields to Selected Fields
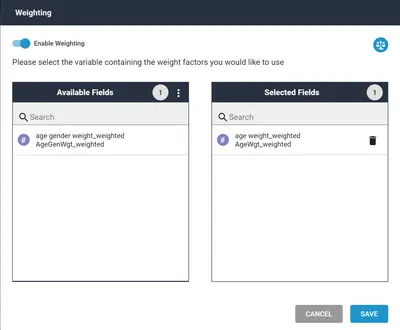
- Click Save
Effective sample size
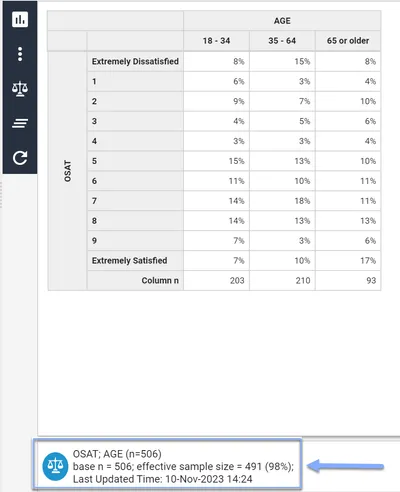
Section titled “Effective sample size”When weights are applied, Data Explorer displays an Effective Sample Size metric. This indicates the equivalent number of unweighted observations that would produce the same statistical precision. Lower effective sample sizes indicate efficiency losses from unequal weights.
Removing weights
Section titled “Removing weights”To remove weighting from your exploration:
- Click the Apply Weights icon in the toolbar
- Toggle weighting to the Off position
- Click Save
Exploration footer
Section titled “Exploration footer”The footer of each exploration displays useful reference information:
- Variable labels used in the analysis
- Base sizes (number of respondents)
- Last modified date
- Weighting indicator and effective sample size (when weights are applied)
Frequently asked questions
Section titled “Frequently asked questions”Why can’t I use rolling periods with my date variable?
Rolling periods are not available for all date aggregation formats. Some specific format combinations (such as certain financial year formats) do not support rolling periods. If the Rolling Periods checkbox is disabled, try selecting a different date aggregation format.
What’s the maximum number of rolling periods I can combine?
You can combine up to 99 periods in a rolling period calculation.
Can I apply multiple weights to a single exploration?
No, you can only apply one weighting variable per exploration. If you need to analyze your data with different weights, create separate explorations for each weighting scenario.
Why isn’t my weighting variable appearing in the list?
Weighting variables must be numeric (decimal type) and have a name ending with _weighted for Data Explorer to recognize them. If your variable doesn’t appear, check that it meets these requirements or use Data Wrangler to create a properly formatted weight variable.
What’s the difference between merging and netting?
Merging combines multiple categories into one, replacing them with a single merged category. Netting creates an additional summary row or column that shows the combined total while keeping the original categories visible. Use merging when you want to simplify your data; use netting when you want to show subtotals alongside the detail.
Can I filter by date ranges?
Yes, date variables support special filter options including preset ranges (Today, Yesterday, Start of Week, etc.) as well as custom date ranges. You can also combine date filters with offset adjustments to create relative date filters.
What do the statistical test results mean?
When Stat Testing is enabled, Data Explorer performs t-tests (for means) and z-tests (for proportions) to identify statistically significant differences between groups. Results are highlighted to show whether values are significantly higher or lower than expected.
Why can’t I edit this exploration?
There are two common reasons why you might not be able to edit an exploration:
- The exploration is locked - Locked explorations cannot be edited until they are unlocked by the workspace owner or the person who created the exploration.
- You have read-only access - If you were granted Can Read permission when the workspace was shared with you, you can only view explorations and cannot switch to Edit mode.
In both cases, contact the workspace owner to request edit access or to have the exploration unlocked. To find the owner, click the ellipsis menu next to the workspace name and select Share - the owner’s name will be displayed in the sharing dialog.
Can I duplicate an exploration?
Yes. In the workspace navigator, click the ellipsis menu next to the exploration you want to copy and select Duplicate. Enter a name for the new exploration and it will be created with the same settings as the original.
How do I remove missing data from my results?
Use the Remove Missing option in your filter settings to exclude null or missing values from your analysis. This is particularly useful when you want to focus only on responses that have complete data.
What happens to my data exploration labels if I update labels in the Survey Shaper survey?
Data Explorer explorations apply the survey variable label that is current at the time the exploration is created, regardless of what the variable label was at the time the survey response was received.
If a variable label is changed after an exploration has been created from the variable, the exploration will need to be recreated to ensure the new label is displayed.
Common issues and solutions
Section titled “Common issues and solutions””Statistical testing isn’t showing any results”
Section titled “”Statistical testing isn’t showing any results””Stat testing requires specific conditions to produce meaningful results.
- Verify sample sizes - Very small samples may not produce statistically significant differences
- Check your data structure - You need at least two columns to compare for stat testing to work
- Enable the option - Make sure Stat Testing is toggled on in your format options
”My weight variable isn’t appearing”
Section titled “”My weight variable isn’t appearing””Weight variables must meet specific requirements to be recognized by Data Explorer.
- Check the variable name - It must end with
_weighted(e.g.,age_weighted) - Verify the data type - Weight variables must be numeric (decimal type)
- Confirm data store access - You need access to the data store containing the weight variable
”Changes I made disappeared”
Section titled “”Changes I made disappeared””Your changes may not have been saved, or you might be viewing a cached version.
- Use Undo - Click the Undo button to recover recent changes within your session
- Check your mode - Ensure you saved before switching from Edit to View mode
- Refresh the exploration - Sometimes refreshing loads the latest saved version