

Sentiment vs Occurrence
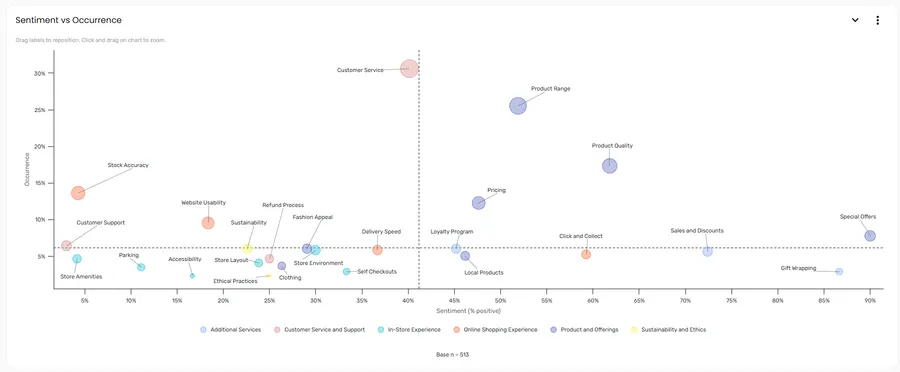
The Sentiment vs Occurrence section plots every sub topic on a scatter chart using two axes — how positive the sentiment is, and how often each sub topic is mentioned. This gives you a quick visual read on where to focus: the topics that are both frequently mentioned and mostly negative are the ones most worth addressing.
Reading the chart
Section titled “Reading the chart”Each point on the chart represents one sub topic. Its position is determined by:
| Axis | What it measures |
|---|---|
| Horizontal (X) | Sentiment (% positive) — the percentage of the sub topic’s mentions that are positive, from 0% (left) to 100% (right) |
| Vertical (Y) | Occurrence — how frequently the sub topic is mentioned across all responses |
Dashed lines divide the chart into four quadrants, and each point is coloured by its topic — use the legend to see which colour is which topic.
Sub topics in the upper-right are frequently mentioned and mostly positive. Sub topics in the upper-left are frequently mentioned but mostly negative — these are typically the highest-priority areas for action.
Interacting with the chart
Section titled “Interacting with the chart”Hover over any point to see the sub topic name along with its occurrence and sentiment. Click a point to open the comment viewer filtered to that sub topic, so you can read the individual responses behind the data.
Labels appear next to each data point by default. Drag any label to reposition it if points are overlapping and labels are hard to read.
Click and drag on the chart area to zoom in on a region. To reset the zoom, click the Reset Zoom button in the top-right corner of the zoomed chart.
Section controls
Section titled “Section controls”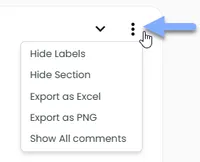
Use the ⋮ menu in the top-right corner of the section card to access these options:
| Option | What it does |
|---|---|
| Hide Labels | Toggles the sub topic name labels on and off |
| Hide Section | Removes the section from view. Use Manage Layout in the report settings to restore it. |
| Export as Excel | Downloads the underlying chart data as a spreadsheet |
| Export as PNG | Downloads the chart as a PNG image |
| Show All comments | Opens the comment viewer showing comments across all sub topics in the current chart view |
Frequently asked questions
Section titled “Frequently asked questions”Do the filter bar selections affect this chart?
Yes. The Sentiment vs Occurrence chart responds to the filter bar at the top of the report. Selecting a timeframe, period, or filter variable updates the chart to reflect only the filtered data.
Why are some sub topics clustered together?
Sub topics with similar occurrence rates and sentiment scores will appear close together on the chart. This can indicate related themes that respondents discuss in similar ways — or it may simply reflect that those topics have comparable volumes and sentiment profiles in your dataset.
What’s the difference between this chart and the other sentiment charts?
The Most Mentioned, Topic Sentiment, and Sub Topic Sentiment charts show ranked lists, sorted by one dimension at a time. The Sentiment vs Occurrence chart shows both dimensions simultaneously, making it easier to spot sub topics that are both high-volume and strongly polarising. Use the bar charts to rank; use this chart to find the intersection.
I can’t see this section in my report — where has it gone?
It may have been hidden. Open the settings menu in the report toolbar and select Manage Layout to see all available sections and toggle them back on.